


 Gold Prices Fall Amid Rate Jitters; Copper Steady as China Stimulus Eyed
  FxWirePro: Daily Commodity Tracker - 21st March, 2022


Here are some key charts based on data from the United States’ Energy Information Agency’s (EIA) latest report that explains the level of inventories, refinery demand, and production.
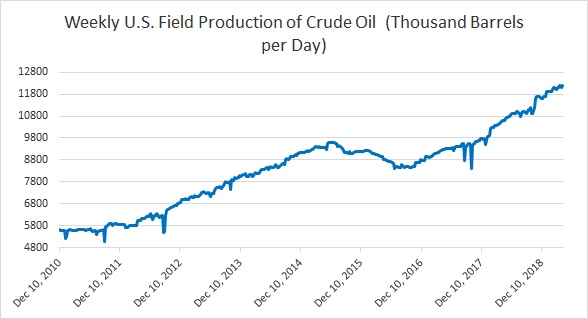
- Chart 1 shows crude oil production in the United States at a record high of 12.2 million barrels per day.
- Chart 2 shows the level of U.S. distillate inventories. According to the latest report, the inventory declined last week to 127 million barrels.
- U.S. oil imports have been declining over the past couple of year. However, last week, it rose to 7.15 million barrels per day, largely due to lower refinery demand.
- Chart 4 shows the level of U.S. crude oil exports, which rose to a new record high of 3.61 million barrels per day last month. Last week, it was 2.68 million barrels per day.
- Chart 5 shows U.S. refinery operating at 90.1 percent. Refinery intake has taken a sharp dive from 97 percent in January but up from 85.9 percent in mid-February.
- Chart 6 shows the level of crude oil inventories, which has declined to around 91 million barrels since its peak in April 2017. Inventories declined last week to 460.6 million barrels.


