


 Best Gold Stocks to Buy Now: AABB, GOLD, GDX


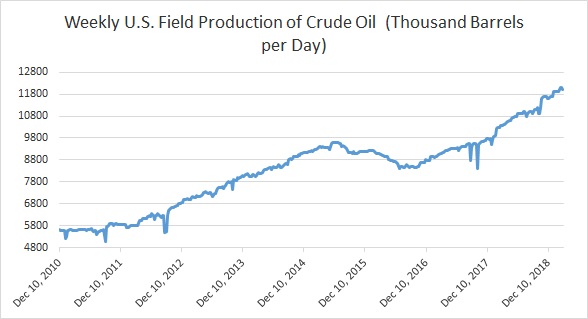
Here are some key charts based on data from the United States’ Energy Information Agency’s (EIA) latest report that explains the level of inventories, refinery demand, and production.
- Chart 1 shows crude oil production in the United States at 12 million barrels per day, which slipped from a record high of 12.1 million barrels per day.
- Chart 2 shows the level of U.S. distillate inventories. According to the latest report, the inventory rose last week to 136.4 million barrels.
- U.S. oil imports have been declining over the past couple of year. Last week, it declined to 6.75 million barrels per day, largely due to lower refinery demand.
- Chart 4 shows the level of U.S. crude oil exports, which rose to a new record high of 3.61 million barrels per day last month. Last week, it declined to 2.55 million barrels per day.
- Chart 5 shows U.S. refinery operating at 87.6 percent. Refinery intake has taken a sharp dive from 97 percent in January.
- Chart 6 shows the level of crude oil inventories, which has declined to around 102 million barrels since its peak in April 2017. Inventories declined last week to 449.1 million barrels.


