


 Gold Prices Fall Amid Rate Jitters; Copper Steady as China Stimulus Eyed
  FxWirePro: Daily Commodity Tracker - 21st March, 2022


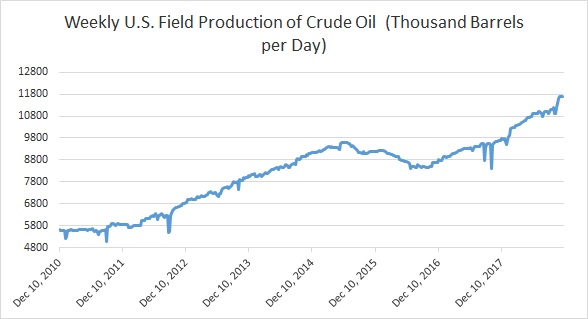
Here are some key charts based on data from the United States’ Energy Information Agency’s (EIA) latest report that explains the level of inventories, refinery demand, and production.
- Chart 1 shows crude oil production in the United States rose to new record high of 11.7 million barrels per day.
- Chart 2 shows the level of U.S. distillate inventories. According to the latest report, the inventory rose to 125.6 million barrels.
- U.S. oil imports have been declining over the past couple of year. But, it has gone up rapidly in recent times thanks to higher refinery demand. Last week, it declined sharply to 7.22 million barrels per day.
- Chart 4 shows the level of U.S. crude oil exports, which rose to a new record high of 3.2 million barrels per day last week.
- Chart 5 shows U.S. refinery operating at 95.5 percent. Refinery intake picked up recently but still lower than 98.1 percent a few months ago, which was the fastest pace since 1998.
- Chart 6 shows the level of crude oil inventories, which has declined around 108 million barrels since its peak in April 2017. Inventories rose last week to 443.2 million barrels.


