


 Gold Prices Fall Amid Rate Jitters; Copper Steady as China Stimulus Eyed
  Best Gold Stocks to Buy Now: AABB, GOLD, GDX


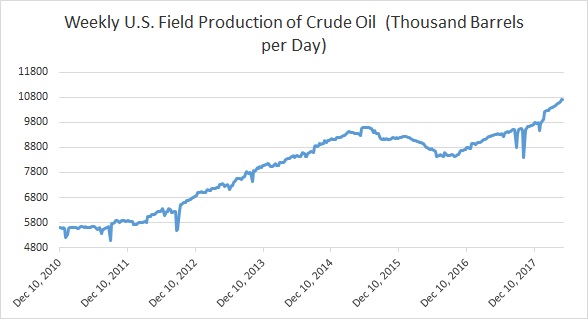
Here are some key charts based on data from United States’ Energy Information Agency’s (EIA) latest report that explains the level of inventories, refinery demand, and production.
- Chart 1 shows crude oil production in the United States which has reached a new all-time high. It rose last week to 10.725 million barrels per day last week compared to 10.723 million barrels per day in the week before.
- Chart 2 shows the level of U.S. distillate inventories. It has been declining rapidly. According to the latest report, the inventory declined to 114 million barrels.
- U.S. oil imports have been declining over the past couple of year. However, Chart 3 shows that imports rose last week to 8.16 million barrels per day.
- Chart 4 shows the level of U.S. crude oil exports, which declined last week to 1.75 million barrels per day after reaching a new record high of 2.566 million barrels per day in the previous week.
- Chart 5 shows U.S. refinery operating at 91.8 percent capacity.
- Chart 6 shows the level of crude oil inventories, which has declined around 92 million barrels since March 2017. Inventories have risen last week to 438.1 million barrels.
FxWirePro launches Absolute Return Managed Program. For more details, visit http://www.fxwirepro.com/invest


