


 Fed May Resume Rate Hikes: BofA Analysts Outline Key Scenarios
  U.S. Stocks vs. Bonds: Are Diverging Valuations Signaling a Shift?
  UBS Projects Mixed Market Outlook for 2025 Amid Trump Policy Uncertainty
  Oil Prices Dip Slightly Amid Focus on Russian Sanctions and U.S. Inflation Data
  Stock Futures Dip as Investors Await Key Payrolls Data
  BTC Flat at $89,300 Despite $1.02B ETF Exodus — Buy the Dip Toward $107K?
  Moody's Upgrades Argentina's Credit Rating Amid Economic Reforms
  US Futures Rise as Investors Eye Earnings, Inflation Data, and Wildfire Impacts
  Global Markets React to Strong U.S. Jobs Data and Rising Yields


The volatility smile most often signifies that traders are willing to pay higher implied volatility prices as the strike price grows aggressively out of the money.
Among G3 FX volatility space, EURJPY 3m-6m risk reversal is one of the highest compared with ATM volatility of the peer group, suggesting euro calls that sell topside skew.
The EURJPY volatility surface is offering very attractive opportunities because the skew on the 6m and 1y is currently excessive (refer above graph).
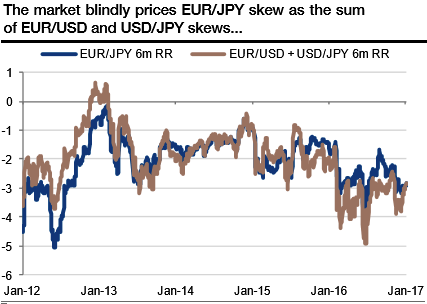
Is EURJPY IV skew mispricing? If we consider that the options market is pricing EURJPY risk reversals (RR) as the sum of EURUSD and USDJPY RR, the triangle is perfectly priced.
The implied volatility of 6m and 1y 25-delta strikes is trading about 3 volatility points higher than ATM volatility, which supposes that the implied volatility should be strongly negatively correlated with the FX rate.
Since 2013, the EURJPY RR has strongly mean reverted towards the vol/spot correlation. However, this correlation has been about zero for a few weeks, such that EURJPY 6m skew is now disconnected from its fair value.
Splitting the EURJPY RR into EURUSD and USDJPY components, like the market, exhibits the source of this mispricing. The EURUSD 6m RR is trading at -1.8 and the USDJPY at -1.1. The former is consistent with the EURUSD price action, which actually saw downside volatility.
However, USDJPY has indeed been positively correlated with its volatility, hence the EURJPY mispricing comes from the yen side. Investors could directly consider selling the USDJPY excessive skew, but we recommend selling the EURJPY skew instead. It offers a larger risk premium (due to the fairly priced EURUSD smile component), which is opportunistic given our bullish bias on the spot.


