


 FxWirePro- Major Crypto levels and bias summary
  JPMorgan Lifts Gold Price Forecast to $6,300 by End-2026 on Strong Central Bank and Investor Demand
  BTC Flat at $89,300 Despite $1.02B ETF Exodus — Buy the Dip Toward $107K?


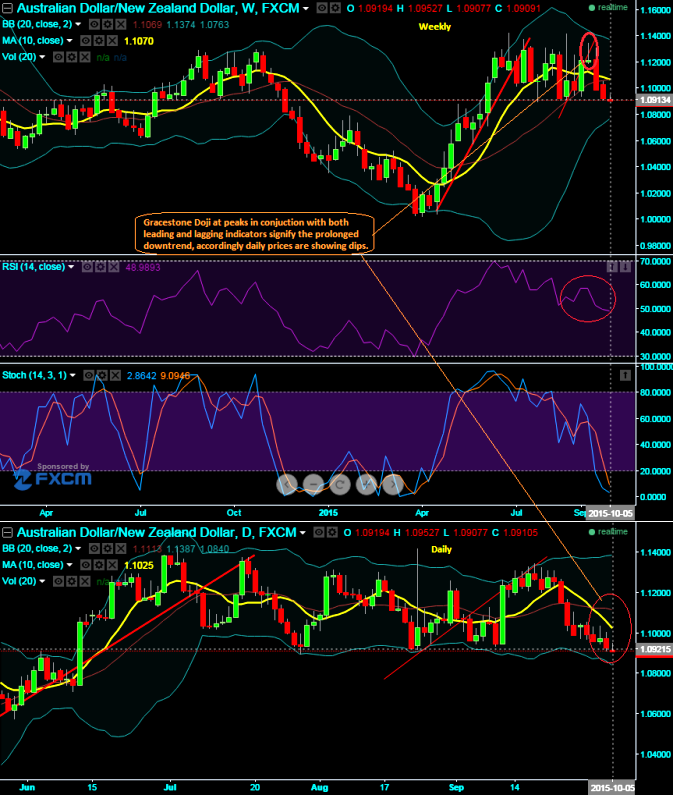
We traced out bearish gravestone doji pattern around 1.1218 levels on weekly charts in earlier post, and leading oscillators to substantiate current price fluctuations.
This bearish pattern doji is an extremely helpful for traders visually see where resistance and supply is likely located. After an uptrend, the Gravestone Doji can signal to traders that the uptrend could be over and that long positions should probably be exited.
But other indicators should be used in conjunction with the Gravestone Doji pattern to determine an actual sell signal. A potential trigger could be a break of the upward trendline support.
Now the rest all is history and the current prices have shown their impact of this bearish candle pattern.
We maintain our bearish stance on this pair as the prices have been well below moving average curve that signals us long term bearish trend is on the cards.
The pair has pretty much achieved our earlier target at 1.0949, we could now foresee and maintain our next target for this pair is at 1.0878 levels towards south.
RSI on weekly is currently trending near 49.0644, while %D crossover on slow stochastic still maintains even below 20 levels that signifies bearish momentum is continuing. Daily prices are well below moving average curve.
Trade recommendation: Last month's diagonal strips have taken care of upswings and downswings and yielded handsome returns and we are firm onto continue with the same.

- News

- Economy

- Central Banks
- Investing
- Research
- Roundups
- Digital Currency
- Insights
- Technical Analysis
- Technology
- Business
- Law
- Health
- Nature
- Fintech
- Science
- Topic
- Opinions
- ©Econometrics LLC . All Rights Reserved.
FxWirePro: Gravestone Doji on AUD/NZD - bearish swings to prolong
Monday, October 5, 2015 6:37 AM UTC
Editor's Picks


- Market Data
Most Popular


3


