


 FxWirePro- Major Crypto levels and bias summary
  JPMorgan Lifts Gold Price Forecast to $6,300 by End-2026 on Strong Central Bank and Investor Demand
  Nasdaq Proposes Fast-Track Rule to Accelerate Index Inclusion for Major New Listings


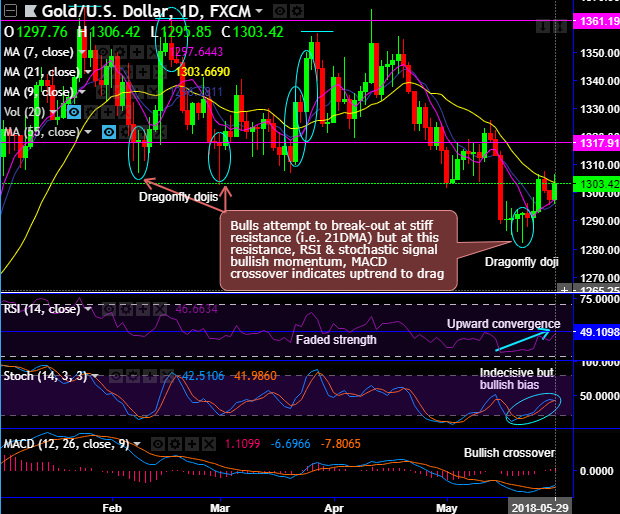
The gold (XAUUSD) forms dragonfly doji pattern candles occur at 1,292.53 levels which is bullish in nature.
Ever since then bulls have taken off the rallies, attempt to bounce back and break-out at stiff resistance (i.e. 21DMA) but restrained below this resistance.
While RSI and stochastic oscillators signal bullish strength and the intensified momentum in the ongoing rallies (refer daily charts).
MACD on the other hand show bullish crossover that indicates the uptrend to drag further.
The gold in intermediate trend has been spiking through rising wedge pattern which is again a bullish pattern, you could see bulls popping up at wedge support with hammer formation (see the circled area on weekly plotting).
The intermediate trend has been stuck in the tight range between $1,368.20 and $1,300.89 levels. To counter downswings, the hammer pattern has occurred at $1314.88 to intensify rallies.
While RSI and stochastic curves have been showing upward convergence on daily plotting.
As you could make out that the price has been oscillating between 1365 and 1306.40 levels since 3rd January, the long-term investors should wait and watch out closely for decisive breach below 1365-68 levels but deploy a wise hedging for upside risks.
Well, at spot reference: $1,301 levels, in order to participate in prevailing edgy but mild bullish interests, we advocate buying boundary spreads using upper strikes at 1307.83 and lower strikes at 1295.85 levels.
Alternatively, with a view to arresting potential upside risks, we advocate buying futures contracts of far-month tenors.
FxWirePro launches Absolute Return Managed Program. For more details, visit:


