


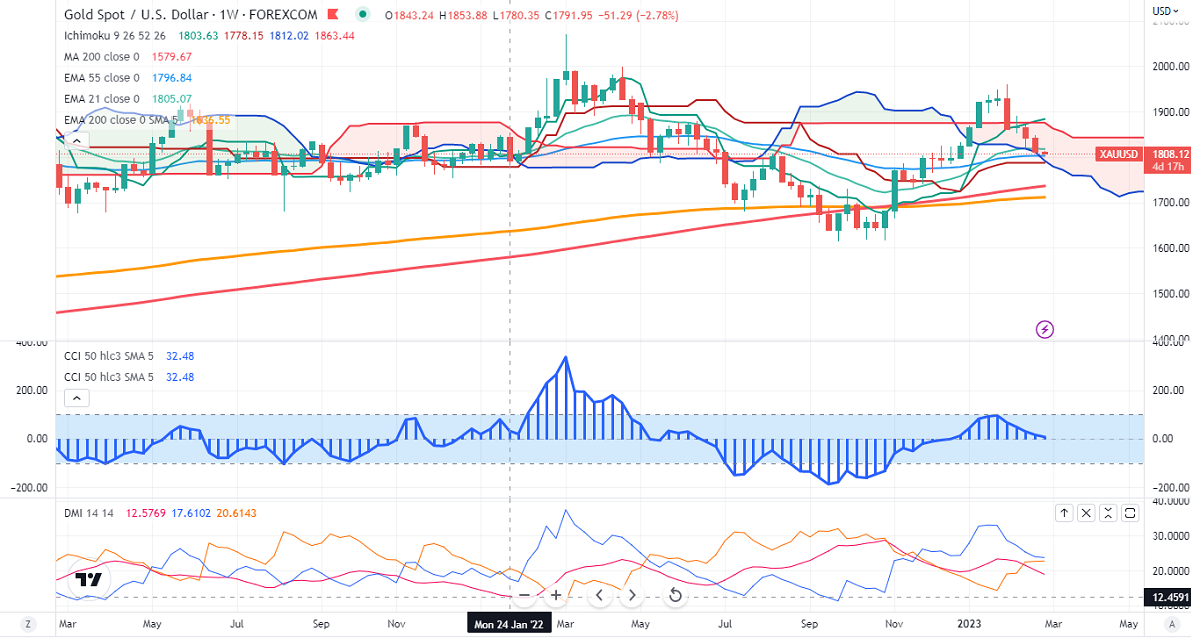
Ichimoku Analysis (Weekly chart)
Tenken-Sen- $1878.40
Kijun-Sen- $1787.50
Gold prices lost their shine on board-based US dollar buying. The yellow metal pared most of its gains after hawkish US Fed meeting minutes. It hits an intraday low of $1806.78 and is currently trading around $1807.50.
The economy expanded at an annual pace of 2.7%, slightly lower compared to an estimate of 2.9%. The report said that core inflation surged to 4.3% in the fourth quarter vs. the forecast of 3.9%. The number of people who have filed for unemployment benefits dropped by 3000 to 192000 for the week ended 18 Feb, the lowest level in 3 weeks.
Major economic data for this week
Feb 27th US durable goods orders
US Pending home sales
Feb 28th US CB consumer confidence
Mar 1st US ISM manufacturing PMI
Mar 3rd US ISM services PMI
US dollar index-Bullish. Minor support around 102.50/101.50. The near-term resistance is 105.35/106.
According to the CME Fed watch tool, the probability of a 50 bpbs rate hike in Mar jumped to 27.7% from 18.1% a week ago.
The US 10-year yield recovered above 3.95% after a minor sell-off. The US 10 and 2-year spread widened to -89 basis points from -77% bpbs.
Factors to watch for gold price action-
Global stock market- bearish (Positive for gold)
US dollar index - Bullish (Neutral for gold)
US10-year bond yield- Bullish (negative for gold)
Technical:
The near–term support is around $1800, a break below targets of $1788/$1748. The yellow metal faces minor resistance around $1820, and a breach above will take it to the next level of $1840/$1857.
It is good to sell on rallies around $1825-26 with SL around $1855 for TP of $1780.


