


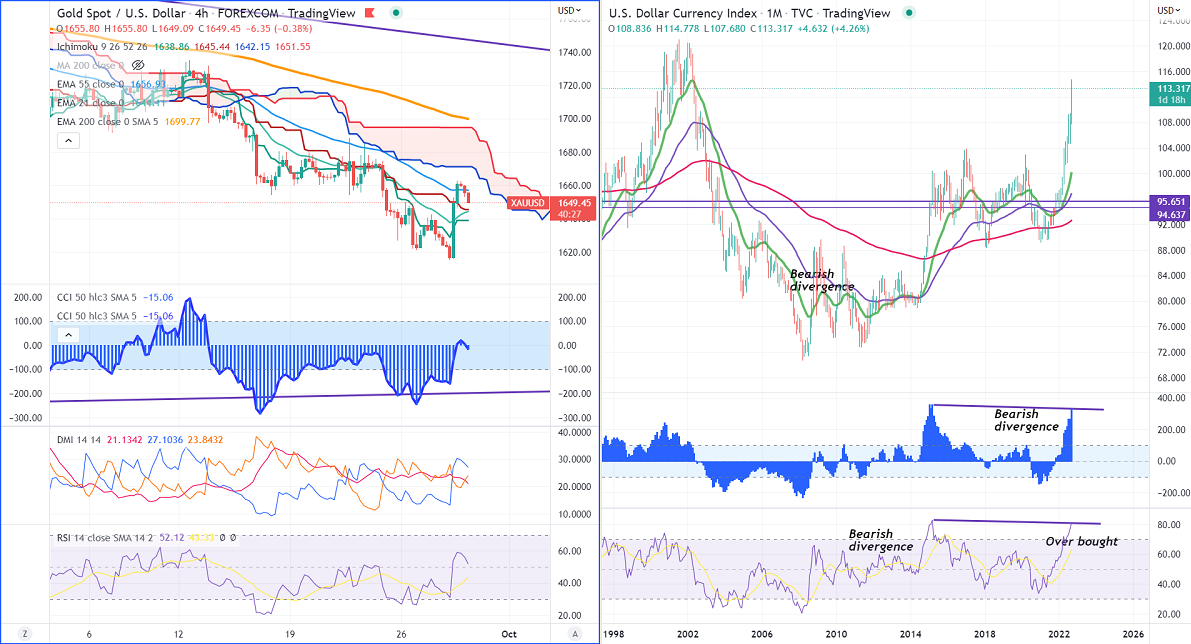
Ichimoku Analysis (4-hour Chart)
Tenken-Sen- $1638.86
Kijun-Sen- $1645.44
Gold recovered sharply and jumped more than $30 on dollar weakness. US dollar index pared some of its gains made this week on profit booking.
RSI in Monthly chart-
US dollar index- 81.49 (Overbought)
Bearish divergence in the monthly chart (CCI- 50) (positive for gold).
US Treasury yield- US 10-year bond yield cooled off more than 7.5% after hitting a multi-year high of 4.019%.
The US pending home sales dropped to -2% mom in August for the third consecutive month compared to the forecast of -14%. Markets eye US GDP data for further direction.
According to the CME Fed watch tool, the probability of a 75 bpbs rate hike in Nov dropped to 58% from 70.1% a week ago.
Technical:
The near–term support is around $1620, a close below targets $1598/$1580.The yellow metal faces minor resistance around $1665, the breach above will take it to the next level of $1680/$1700/$1720. Minor bullish continuation only if it breaks $1740.
It is good to buy on dips around $1640-42 with SL around $1600 for TP of $1740.


