


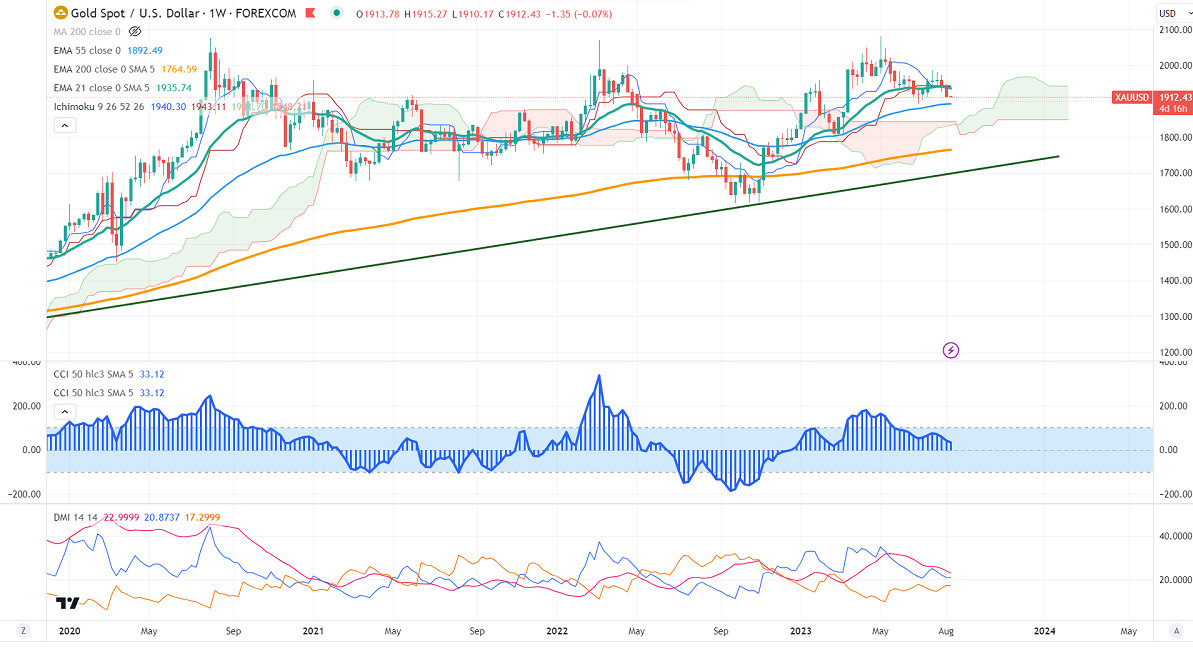
Ichimoku Analysis (4- Hour chart)
Tenken-Sen- $1940.30
Kijun-Sen- $1943.11
Gold lost more than $30 previous on easing US inflation. It hits a low of $1910.17 yesterday and is currently trading around $1914.73.
US annual CPI rose 3.2% in Jul, compared to a forecast of 3.3%. The headline and core inflation m/m came at 0.20% in line with expectations. Core PPI edged marginally higher to 0.30%, slightly above the forecast of 0.20%. The number of people who have filed for unemployment benefits surged to 248000 in the week ended Aug 5, the highest level since the week ended on Jul 1st.
Major economic data for the day
Aug 15th, 2023, US Core retail sales m/m (12:30 pm GMT)
Canada CPI m/m (12:30 pm GMT)
Aug 16th, 2023, US FOMC meeting minutes (6 pm GMT)
Aug 17th, 2023, US Unemployment claims (12:30 pm GMT)
US dollar index- Bullish. Minor support around 102/101. The near-term resistance is 103/104.
According to the CME Fed watch tool, the probability of a no-rate hike in Sep decreased to 88.5% from 90% a week ago.
The US 10-year yield trades higher for the fourth consecutive week despite weak US inflation. The US 10 and 2-year spread narrowed to -74% from -110%.
Factors to watch for gold price action-
Global stock market- bullish (negative for gold)
US dollar index - Bullish (bearish for gold)
US10-year bond yield- Bullish (negative for gold)
Technical:
The near–term support is around $1900, a break below targets of $1885/$1867. The yellow metal faces minor resistance around $1950 and a breach above will take it to the next level of $1955/$1970/$1985.
It is good to sell on rallies around $1930-32 with SL around $1950 for TP of $1870.


