


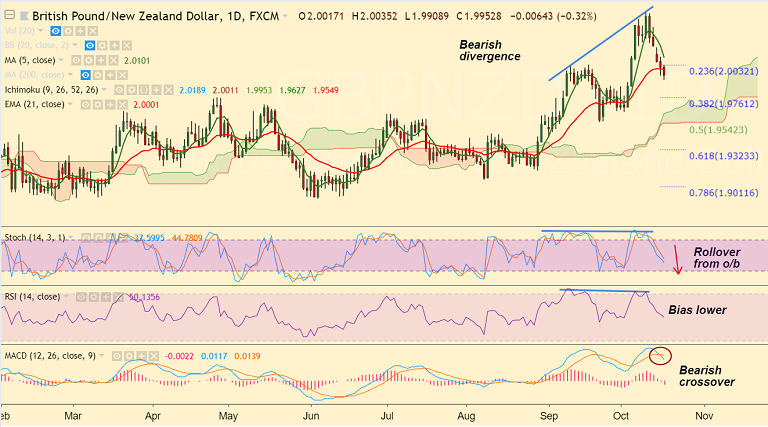
GBP/NZD chart on Trading View used for analysis
- GBP/NZD slumps lower after UK inflation data unexpectedly misses forecasts.
- UK headline inflation decelerated sharply to 2.4% y/y in September, missing the market estimate of 2.8% y/y rise. The core inflation decelerated to 1.9% in September.
- GBP/NZD is extending weakness for the 5th straight session, trades 0.31% lower on the day at 1.9954 at the time of writing.
- Technical indicators are biased lower. RSI and stochs support downside. We see bearish MACD line crossover on signal line.
- We also evidence bearish divergence on RSI and Stochs which adds to bearish bias.
- The pair has broken below 20-DMA and finds next major support at 38.2% Fib at 1.97612.
- Retrace above 20-DMA could see minor upside. Breakout at 5-DMA negates bearish bias.
Support levels - 1.97612 (38.2% Fib), 1.9627 (cloud top), 1.9575 (110-EMA)
Resistance levels - 2.00 (21-EMA), 2.0100 (5-DMA)
Recommendation: Good to go short on upticks, SL: 2.01, TP: 1.9760/ 1.9630/ 1.9575
For details on FxWirePro's Currency Strength Index, visit http://www.fxwirepro.com/currencyindex.


