


 Elon Musk’s Empire: SpaceX, Tesla, and xAI Merger Talks Spark Investor Debate
  BTC Flat at $89,300 Despite $1.02B ETF Exodus — Buy the Dip Toward $107K?
  FxWirePro- Major Crypto levels and bias summary


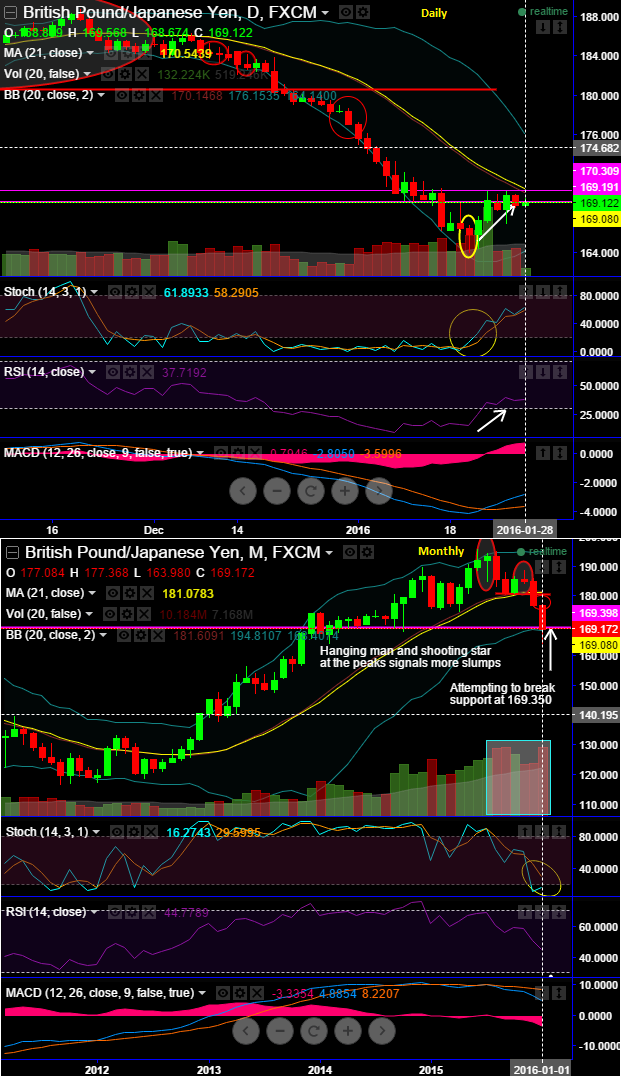
A sharp "shooting star" was spotted out whose highs were rejected at where it has tested resistance at 1.4352 several times in the recent past as well.
We kept urging that there would be range bounded swings on this pair where upper band is 1.4358 which is maintaining as a resistance point so far, while 1.4124 as support from last couple of days (From 18th January).
In between, the pair has also made an intermediary channel with a range of 200 pips within which it has acted as resistance and support several times in the recent past (see grey shaded areas).
Both oscillators approaching overbought territory and initiating any fresh longs are not advisable for intraday traders (see intraday charts).
RSI: Although, current daily RSI (14) trending above 36.6900 levels that is converging to the price upswings but there is no clarity about the trend form this oscillator because there is no substantiation from other indicators, on closing basis movement should be closely watched if it suggests downward signals.
Stochastic: Although there is neither a trace of overbought nor oversold situation, it alarms bears trying to take over the rallies as the slow stochastic noises with %D line cross over around 40 levels (current %D line flashes at 38.0335).
Even though prices have jumped a bit from last couple of days, it has remained well below 21DMA.
Hence, we would foresee GBP on weaker side on the back of today's GDP outcome even though it shows slight jump. So, with spot FX at 1.4294 the smart trade idea would be instead of initiating new longs, use these rallies for better entry points to short for targets upto 1.4204 keeping the stop loss at 1.4352 as we mentioned above (the resistance).

- News

- Economy

- Central Banks
- Investing
- Research
- Roundups
- Digital Currency
- Insights
- Technical Analysis
- Technology
- Business
- Law
- Health
- Nature
- Fintech
- Science
- Topic
- Opinions
- ©Econometrics LLC . All Rights Reserved.
FxWirePro: GBP/USD rallies likely to test trendline resistance – Stay short on rallies for TP 30-40 pips
Thursday, January 28, 2016 9:57 AM UTC
Editor's Picks


- Market Data
Most Popular


