


GBP/USD chart - Trading View
- GBP/USD edges lower from monthly highs at 1.3288, trades at 1.3232 at 0830 GMT.
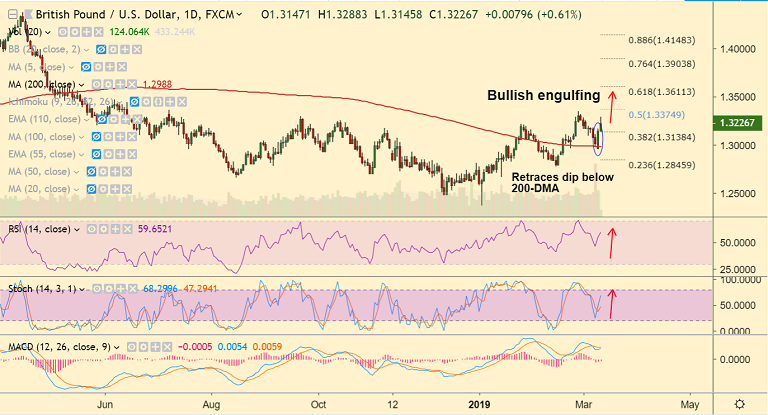
- The pair has formed a 'Bullish Engulfing' candlestick patten on the daily charts raising scope for upside.
- Price action has retraced a brief dip below 200-DMA which is strong support at 1.2988.
- RSI is above 50, bias higher. Momentum studies are bullish. MACD is on verge of bullish crossover on signal line.
- RSI and Stochastics are nicely converging with price action. We see scope for gains till 1.3350.
- Strong resistance lies at 55-W EMA at 1.3258. Close above will see upside continuation.
- Immediate support lies at 5-DMA at 1.3127. Break below 200-DMA neagtes bullish bias.
Support levels - 1.3127 (5-DMA), 1.31, 1.3088 (20-DMA)
Resistance levels - 1.3258 (55-W EMA), 1.33, 1.3350 (Feb 27 high)
Recommendation: Good to go long on dips, SL: 1.2980, TP: 1.33/ 1.3350
For details on FxWirePro's Currency Strength Index, visit http://www.fxwirepro.com/currencyindex.


