


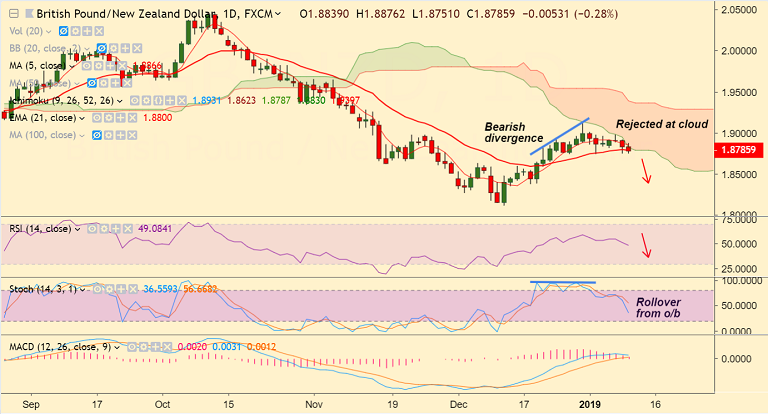
GBP/NZD chart on Trading View used for analysis
- GBP/NZD trades 0.40% lower on the day at 1.8763 at 1245 GMT.
- The pair is on track to close in the red for the second straight week.
- Price action has been rejected at daily cloud with Doji formation raising scope for further weakness.
- Technical studies on daily charts have turned bearish. The pair has slipped below strong support at 21-EMA.
- We notice a bearish divergence on Stochs which raises scope for downside in the pair.
- Break above cloud base required for upside continuation. Next major resistance above cloud base lies at 38.2% Fib at 1.91.
- Break below immediate support at 21-EMA eyes 1.8614 (Jan 2018 low).
Recommendation: Good to go short on decisive break below 21-EMA, SL: 1.8940, TP: 1.8730/ 1.87/ 1.8625
For details on FxWirePro's Currency Strength Index, visit http://www.fxwirepro.com/currencyindex.


