


 Goldman Predicts 50% Odds of 10% U.S. Tariff on Copper by Q1 Close
  Global Markets React to Strong U.S. Jobs Data and Rising Yields
  2025 Market Outlook: Key January Events to Watch
  UBS Projects Mixed Market Outlook for 2025 Amid Trump Policy Uncertainty
  Lithium Market Poised for Recovery Amid Supply Cuts and Rising Demand
  Oil Prices Dip Slightly Amid Focus on Russian Sanctions and U.S. Inflation Data
  U.S. Stocks vs. Bonds: Are Diverging Valuations Signaling a Shift?
  US Gas Market Poised for Supercycle: Bernstein Analysts
  Wall Street Analysts Weigh in on Latest NFP Data
  Moody's Upgrades Argentina's Credit Rating Amid Economic Reforms


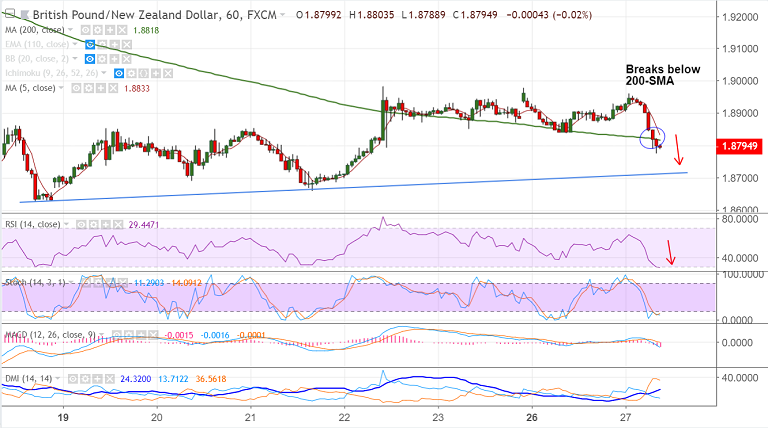
GBP/NZD chart on Trading View used for analysis
- GBP/NZD has broken support at 1H 200 SMA at 1.8818, bias bearish.
- The pair is trading 0.65% lower on the day at 1.8788 at the time of writing.
- Price action has slipped below 5-DMA and is on track to test major trendline support at 1.8715.
- The pair has broken below major support at 110W EMA and finds next major support at 1.8588 (weekly cloud base and 50% Fib). Break below weekly cloud eyes 61.8% Fib at 1.8143.
- On the flipside, stiff resistance is seen at 1.91 (nearly converged 21-EMA and 20-DMA). Break above 200-DMA negates bearish bias.
Support levels - 1.8715 (trendline), 1.8588 (weekly cloud base and 50% Fib)
Resistance levels - 1.8818 (1H 200 SMA), 1.8837 (5-DMA), 1.89
Recommendation: Good to go short on upticks, SL: 1.89, TP: 1.8715/ 1.8660/ 1.86
For details on FxWirePro's Currency Strength Index, visit http://www.fxwirepro.com/currencyindex.


