


On daily charts, ever since the bears activated and plummeting the prices from the peaks of 1.7651 levels, shooting stars appear at 1.7597 and 1.7576 levels, gravestone doji at 1.7612 and the hanging man at 1.7599 levels occurred to signal the weakness in this pair. This was explicitly stated in our previous write up on technical lines, rest is history by now.
Visit the below weblink to for more reading on the same:
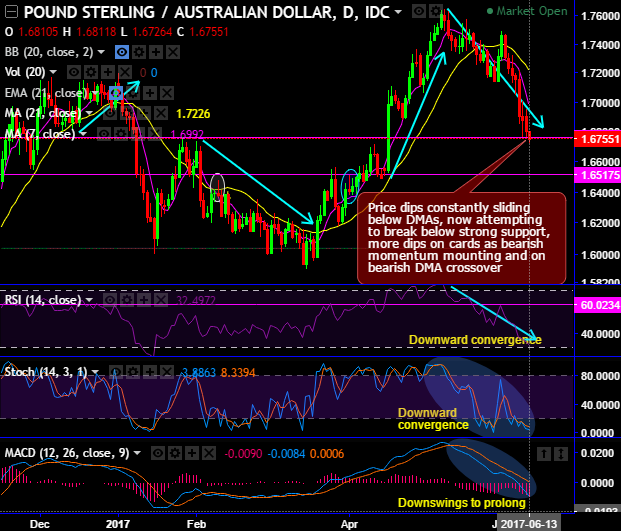
Consequently, the bears managed to constantly evidence price dips below 7DMAs, for now, attempt to breach below strong support at 1.6762 levels where could observe prices curve has shown its demand-supply zone in the recent past.
Expect more slumps on a decisive breach below this mark.
While both leading (RSI and stochastic) indicators are suggestive of intensified bearish momentum.
The stochastic oscillator has been popping up with selling pressures with its %d crossover even below 20 levels which is a bearish indication, while RSI has also been converging to the price dips right from the overbought zone and signals strength in its bearish sentiments.
On the other hand, MACD has also been showing bearish crossover to substantiate above-stated selling interests.
On a broader perspective, as you could see on the monthly plotting, last three months of attempts of upswings have been restrained below 38.2% Fibonacci retracement levels. Consequently, the failure swings have gone below 7EMA.
This is again a strong signal to resume major downtrend again; since the current prices on this timeframe have gone below 7EMA we foresee slumps minimum upto 23.6% Fibonacci retracement levels, hence, the major trend has been bearish bias.
While both leading (RSI and stochastic) indicators are indecisive but no traces of bullish momentum at all.
The stochastic oscillator has been in halting oversold region since June 2016 and still been popping up with selling pressures on monthly plotting, the attempts of %K crossover are not convincing of bull swings that are prevalent while RSI is in bears’ favour.
Overall, the major trend has been bearish bias, while FxWirePro's hourly GBP spot index has turned into -55 (which is bearish while articulating), and hourly AUD spot index was at shy above 55 (bullish). For more details on the index, please refer below weblink:
http://www.fxwirepro.com/currencyindex.
Trading tips:
Well, contemplating above technical reasoning, on speculative grounds we advise betting on binary puts favoring bearish indications.
This strategy is likely to fetch leveraged yields than spot FX and certain yields keeping at ITM strikes (above 40-50 pips).


