


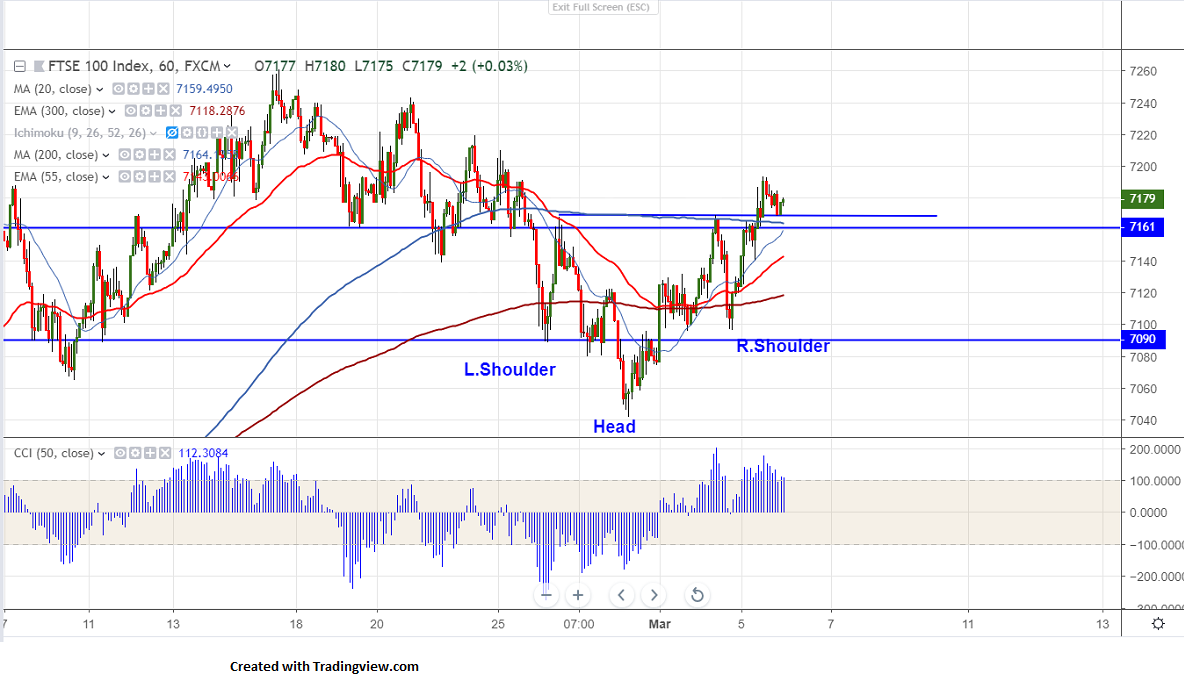
Chart pattern- Inverse head and Shoulder pattern
FTSE100 is trading higher for 5th consecutive day and jumped more than 150 points from low of 7042 made on Feb 28th 2019.The index has formed almost a double bottom around 7095 and shown a good recovery.It has formed temporary top around 7261 and declined sharply on GBP strength.The decline in GBP is supporting FTSE100 index currently and it has lost nearly 200 pips after forming temporary top around 1.3350 on hopes of no deal Brexit.It is currently trading around 7186.
On the higher side, the index has broken neck line around 7165-69 and jumped till 7193. The index is facing strong resistance 7215 (300-day EMA) and break above targets 7262. Any break above 7262 confirms bullish continuation.
The near term support is around 7164 (200- H MA) and any violation below targets 7140/7118 (300- H EMA)/7095.
It is good to buy on dips around 7160-65 with SL around 7120 for the TP of 7262.


