


 - EconoTimes)


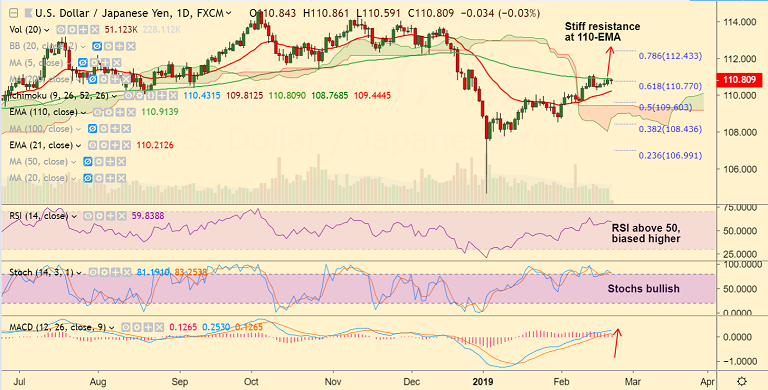
USD/JPY chart on Trading View used for analysis
- USD/JPY edges higher from session lows at 110.59 and is currently trading at 110.80 at 0350 GMT.
- FOMC's Minutes overnight were less dovish than feared, yet confirmed the more cautious perspective from policymakers.
- The pair trades with a slight bullish bias. Technical indicators support upside in the pair.
- We see stiff resistance at 110-EMA at 110.91. Breakout above will see further gains.
- Next major resistance lies at 200-DMA at 111.30 ahead of 78.6% Fib at 112.43.
- On the flipside, 21-EMA is strong support at 110.21. Weakness likely on break below.
Support levels - 110.46 (55-EMA), 110.21 (21-EMA), 109.60 (50% Fib)
Resistance levels - 110.91 (110-EMA), 111.30 (200-DMA), 112
Recommendation: Stay long on breakout above 110-EMA, SL: 110.20, TP: 111.30/ 112
For details on FxWirePro's Currency Strength Index, visit http://www.fxwirepro.com/currencyindex.


