


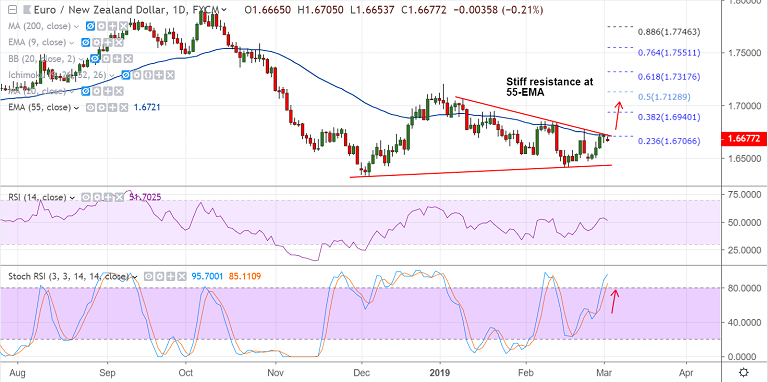
EUR/NZD chart on Trading View used for analysis
- EUR/NZD edges lower from session highs at 1.6705, trades at 1.6663 at 1045 GMT.
- A slight improvement in the EMU Sentix index for the current month fails to impress EUR bulls.
- Data released earlier today showed EMU Sentix index rebounds to -2.2 in March from February’s -3.7.
- Further, EU Producer Prices rose at an annualized 3.0% and 0.4% inter-month in January.
- Focus now on the ECB policy meeting. The ECB is expected to remain in ‘pause mode’ for the foreseeable future amidst the ongoing slowdown in the region.
- EUR/NZD trades with a slight bullish bias on the daily charts. We see stiff resistance at 55-EMA. Breakout could see further upside.
- Immediate support is seen at 5-DMA at 1.6640. Retrace below 21-EMA to see further downside.
Support levels - 1.6640 (nearly converged 5-DMA and 21-EMA), 1.6465 (Feb 25 low), 1.6411 (Feb 15 low)
Resistance levels - 1.6720 (55-EMA), 1.6767 (Feb 22 high), 1.6847 (110-EMA)
For details on FxWirePro's Currency Strength Index, visit http://www.fxwirepro.com/currencyindex.


