EUR/GBP chart - Trading View
Technical Analysis: Bias Bearish
- EUR/GBP slumps lower for the 2nd straight session, hits new 10-week low
- Price action has been rejected at daily cloud and 55-EMA
- The pair is extending downside for the 10th straight week
- Volatility is high as evidenced by widening Bollinger bands
- GMMA indicator shows major and minor trend is bearish
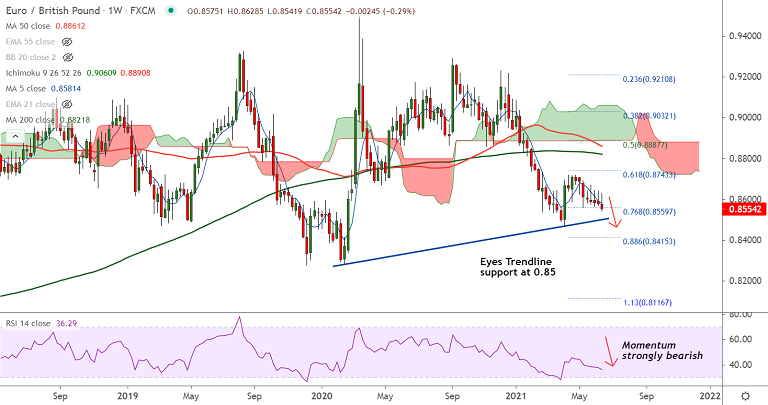
Support levels - 0.85 (Trendline), 0.8472 (110-month EMA), 0.8338 (Lower M BB)
Resistance levels - 0.8579 (5-DMA), 0.8597 (21-EMA), 0.8621 (55-EMA)
Summary: EUR/GBP trades with a bearish bias. Scope for test of trendline support at 0.85. Break below will see test of 88.6% Fib at 0.8415.


FxWirePro- Major Crypto levels and bias summary
FxWirePro- Woodies Pivot(Major)
FxWirePro: EUR/AUD uptrend loses steam, remains on bullish path
FxWirePro- Major Pair levels and bias summary
FxWirePro: GBP/AUD loses momentum but bullish setup remains
FxWirePro- Major US Indices
FxWirePro: USD/ZAR down trend loses steam, remains on bearish path
FxWirePro- Major Pair levels and bias summary
Yen Capitulation Sends GBPJPY to 17-Year Peak – 212.60 Next?
FxWirePro- Major European Indices
0.7870 Break Looms – Next Stop 0.7800 for USDCHF?
Bitcoin Stuck in No-Man’s-Land: $85K Dip or $100K Breakout Next?
AUDJPY: Buy-the-Dip Strategy Intact Above 103.80 Despite Profit-Taking Pullback
Pound Strike Forces EURGBP Retreat – Next Stop 0.8660?
FxWirePro: NZD/USD maintains bullish bias with focus on 0.5900
FxWirePro-Major European Indices 


