


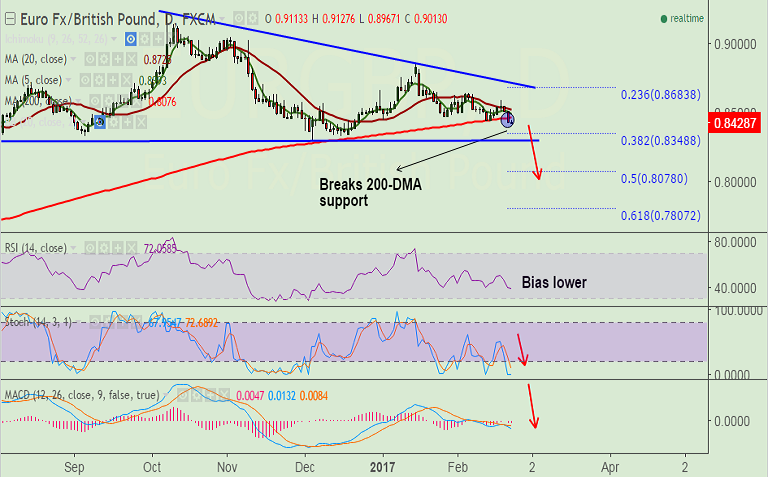
- EUR/GBP trade which had been capped between 20 & 200 day MAs has shown a break below 200-DMA.
- Data last week showed Euro area December quarter GDP was revised down from the flash estimate of 0.5 percent to 0.4 percent quarter-on-quarter.
- UK annual inflation picked up to its highest level in two and a half years, driven by rising fuel and food prices.
- Technical studies have turned bearish. MACD shows downtrend, Stochs and RSI lower.
Support levels - 0.84, 0.8348 (38.2% Fib), 0.8333 (Sept 6, 2016 low)
Resistance levels - 0.8463 (200-DMA), 0.8494 (5-DMA), 0.85, 0.8524 (20-DMA)
TIME TREND INDEX OB/OS INDEX
1H Bearish Oversold
4H Bearish Neutral
1D Bearish Neutral
1W Bearish Neutral
Recommendation: Good to go short on rallies around 0.8450, SL: 0.85, TP: 0.84/ 0.8350/ 0.83
FxWirePro Currency Strength Index: FxWirePro's Hourly EUR Spot Index was at -106.918(Highly bearish), while Hourly GBP Spot Index was at 141.965 (Highly bullish) at 0630 GMT. For more details on FxWirePro's Currency Strength Index, visit http://www.fxwirepro.com/currencyindex.


