


EUR/GBP chart - Trading View
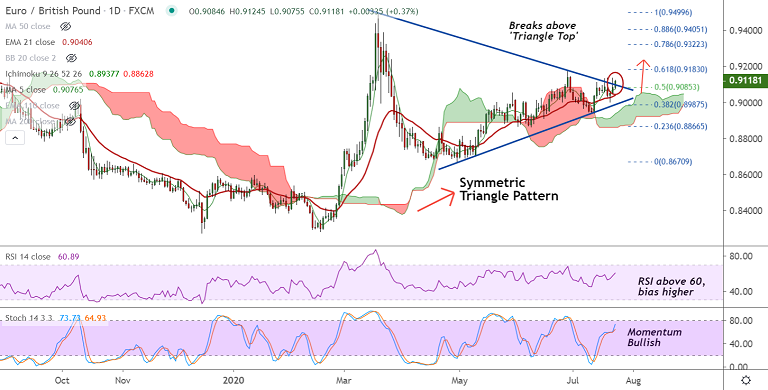
EUR/GBP was trading 0.40% higher on the day at 0.9121 at around 11:45 GMT.
The British pound dented amid Brexit impasse and worsening UK-China relations.
The pair has shown a break above 'Symmetric Triangle' pattern raising scope for further upside.
Technical studies support gains. Stochs and RSI are sharply higher and RSI shows strength above 60 level.
Volatility is rising on the daily charts and analysis of the GMMA indicator shows both major and minor trend are bullish.
Price action has held strong support at 21-EMA, weakness only on break below. Next bull target lies at 61.8% Fib at 0.9183.
Support levels - 0.9077 (5-DMA), 0.9041 (21-EMA)
Resistance levels - 0.9183 (61.8% Fib), 0.9209 (Upper W BB)


