


EUR/GBP chart - Trading View
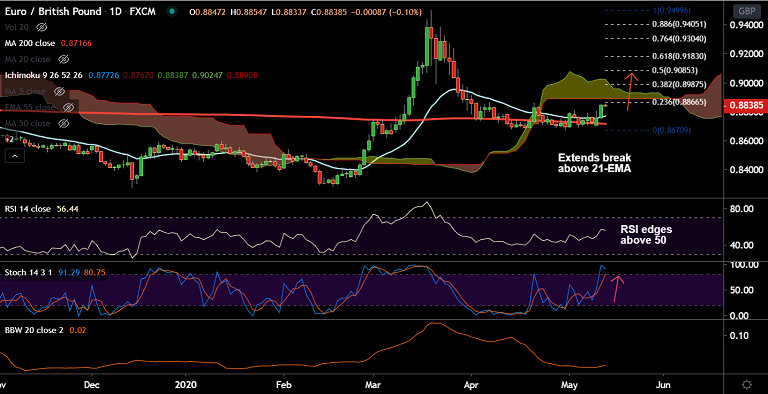
EUR/GBP is consolidating previous sessions gains, was trading marginally lower at 0.8836 (down 0.13%) at around 05:30 GMT.
The pair had been extending sideways grind along 200-DMA support since April, scope for upside rises.
Indicators are now showing signs of upside in the pair. Volatility is rising as evidenced by widening Bollinger bands.
RSI is above 50 and stochs show bullish momentum. Price action has broken above 200W SMA.
Next major hurdle for bulls aligns at daily cloud. Breakout above will open upside. Next bull target above cloud lies at 61.8% Fib retracement at 0.9183.
On the flipside, 21-EMA is immediate support at 0.8770. Retrace below 200-DMA negates any bullish bias.


