


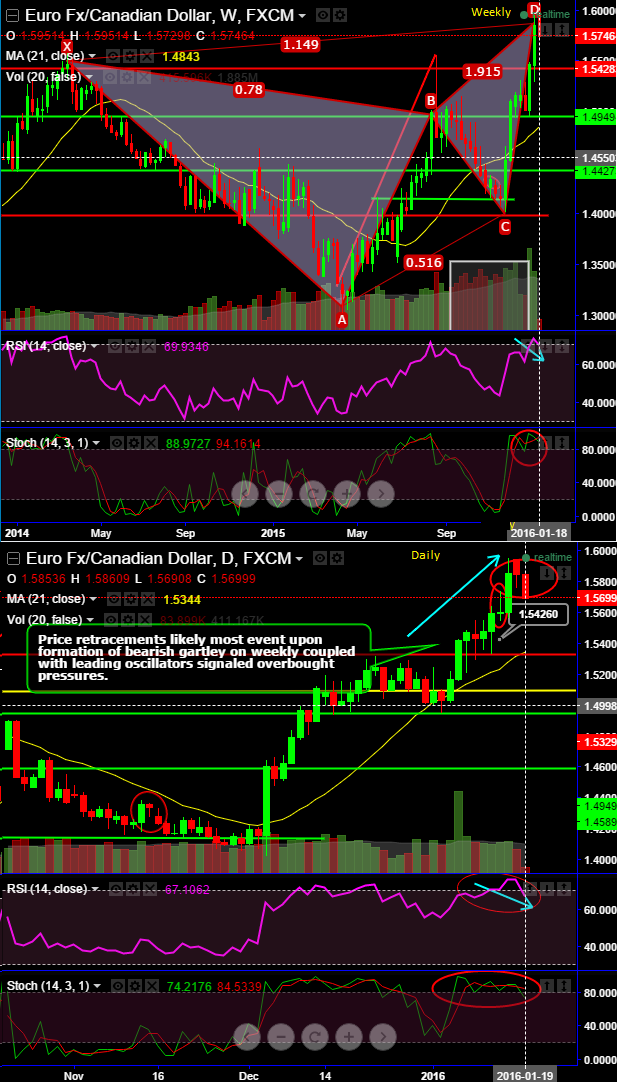
On both weekly and daily price analysis of EURCAD we spotted bearish signals which are red flags for bulls. On daily charts, as you can observe a Doji with highs of 1.5745 on 14th has occurred that is where the "bearish gartley" pattern ended on weeky.
We reckon that the doji at that juncture at around 1.46.04 levels was an early signal for price correction which is to be considered as a caution of previous of upswings. Thereby, from last two days we've been experiencing price dips from the highs of 1.5959 to the current spot at 1.5742.
Upon completion of CD leg in gartley synthesizing with other confirmation, we could foresee more price retracements as the most likely event from here onwards upon formation of bearish gartley on weekly coupled with leading oscillators signaled overbought pressures.
In addition to that leading oscillators are began diverging with the previous price rise both on daily and weekly graphs.
RSI (14) seems to be diverging above overbought trajectory at 75.7744, so, RSI signifies the prevailing down streaks may sustain for some slumps.
While another leading oscillator (slow stochastic) hints us the overbought heaviness through %D crossover above 80 levels which overbought zone though the bulls don't seem to lose rallies built by healthy volumes.
For short term bears can short near month futures eyeing on dips upto 1.5425 levels where it may find supports.
The trading recommendation for speculators on the other hand, would be good to buy binary puts on every rally for targets at 30-40 pips.

- News

- Economy

- Central Banks
- Investing
- Research
- Roundups
- Digital Currency
- Insights
- Technical Analysis
- Technology
- Business
- Law
- Health
- Nature
- Fintech
- Science
- Topic
- Opinions
- ©Econometrics LLC . All Rights Reserved.
FxWirePro: EUR/CAD Bearish Gartley on weekly evidencing daily price dips – expect further slumps for TP at 1.5425
Tuesday, January 19, 2016 7:03 AM UTC
Editor's Picks


- Market Data
Most Popular


