


 Elon Musk’s Empire: SpaceX, Tesla, and xAI Merger Talks Spark Investor Debate
  FxWirePro- Major Crypto levels and bias summary
  JPMorgan Lifts Gold Price Forecast to $6,300 by End-2026 on Strong Central Bank and Investor Demand
  BTC Flat at $89,300 Despite $1.02B ETF Exodus — Buy the Dip Toward $107K?
  Nasdaq Proposes Fast-Track Rule to Accelerate Index Inclusion for Major New Listings


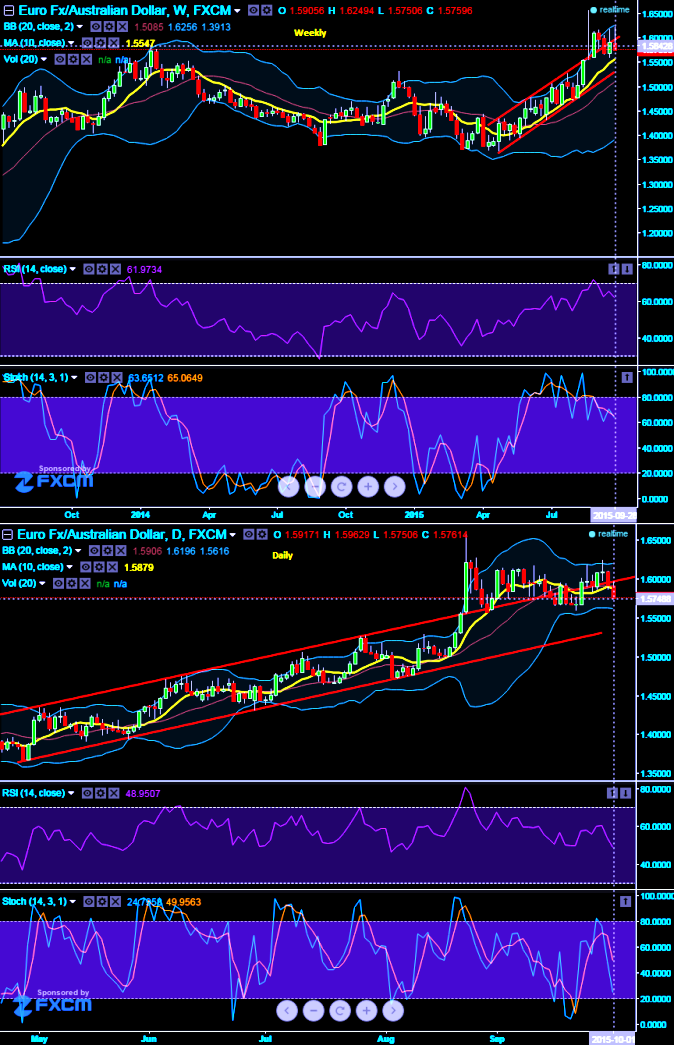
EURAUD breaks channel line support once again at around 1.5917 levels previous to which it has formed spinning top as well but inching towards little upwards slowly, while weekly leading oscillators puzzle by signaling bearish trend as they are converging downwards to the dropping prices.
RSI curve is currently trending at 62.4449 and %D line crossover above 70 level (current %D is at around 65.3309 and %K is at 64.6034) on weekly charts. Prices are falling well below moving average curve as well, so we believe with all these bearish indications, the pair to either remain stagnant or drag towards 1.5696 levels to bounce back again.
Put writers must be alright with the current levels of this pair because on 21st September we advised OTM shorts with 4 day expiry which must have definitely booked profits as the price moved above and 2 lots of 15D longs on ITM puts should be on the job with dips which we've been seeing from last 3 days in arrow form the highs of 1.6249 levels.
EURAUD is currently trading at 1.5779, from here onwards our 2 lots of 15D longs on ITM strike vega puts would start maximizing profits considering the current short term downtrend. Vega in a back spread is generally dominated by the long options the more time there is to expiration and the closer EURAUD is to the strike price of the long options.
15 days of expiration on longs sets up generally the more positive vega the back spread. The reason for this is that far from expiration, the difference between the vega of one strike and the next is relatively small. This is an income strategy. You are looking for a net credit if the pair stays within a range or rises.

- News

- Economy

- Central Banks
- Investing
- Research
- Roundups
- Digital Currency
- Insights
- Technical Analysis
- Technology
- Business
- Law
- Health
- Nature
- Fintech
- Science
- Topic
- Opinions
- ©Econometrics LLC . All Rights Reserved.
FxWirePro: EUR/AUD to extend slumps further but never buck the long term uptrend – certain yields on PRBS
Thursday, October 1, 2015 9:27 AM UTC
Editor's Picks


- Market Data
Most Popular


