


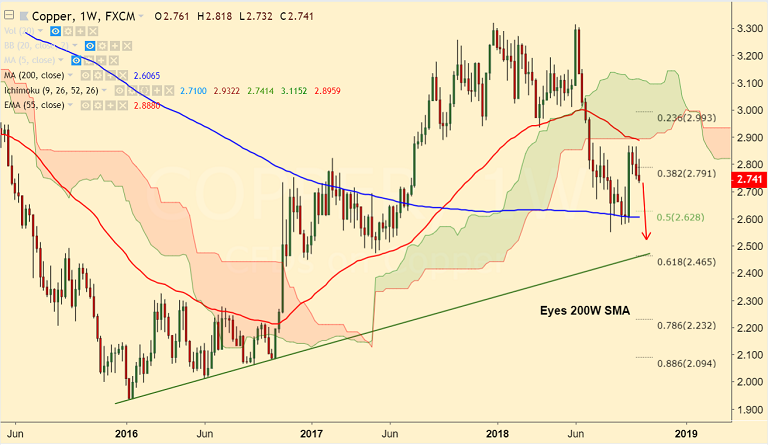
COPPER chart on Trading View used for analysis
- Copper is extending weakness and is on track to close in the red for the 3rd straight week.
- Failure on mutiple attempts to break above 110-EMA have raised scope for further weakness.
- Technical indicators on daily charts have turned bearish with 5-DMA now sloping downward.
- Stochs and RSI on the daily charts are also biased lower and MACD now shows bearish crossover on signal line.
- Price has slipped below 55-EMA and we see scope for dip till 2.6065 (200W SMA).
- 20W SMA is stiff resistance on the upside and we see bullish resumption only on breakout above.
Support levels - 2.707 (Sept 20 low), 2.6065 (200W SMA)
Resistance levels - 2.7651 (5-DMA), 2.8268 (20W SMA)
For details on FxWirePro's Currency Strength Index, visit http://www.fxwirepro.com/currencyindex.


