


 FxWirePro- Major Crypto levels and bias summary
  Dollar Dominance: USDCHF Defies Resistance Amid Greenback Surge
  FxWirePro- Woodies Pivot(Major)
  Ethereum Trails Bitcoin’s Retreat: Key Support Levels in Focus
  GBP/JPY Technical Outlook: Pound Gains Ground Amid Geopolitical Consolidation
  Ethereum’s $2,200 Ceiling: Can Diplomatic Breakthroughs Dissolve the Bearish Resistance?
  FxWirePro- Major European Indices
  Bitcoin Retreats as Geopolitical Tensions Flare: BTC/USD Dips Following Iran’s Rejection of Ceasefire
  FxWirePro- Major Pair levels and bias summary
  FxWirePro- Major Crypto levels and bias summary
  FxWirePro: EUR/NZD positions for another climb, eyes 2.0100 level


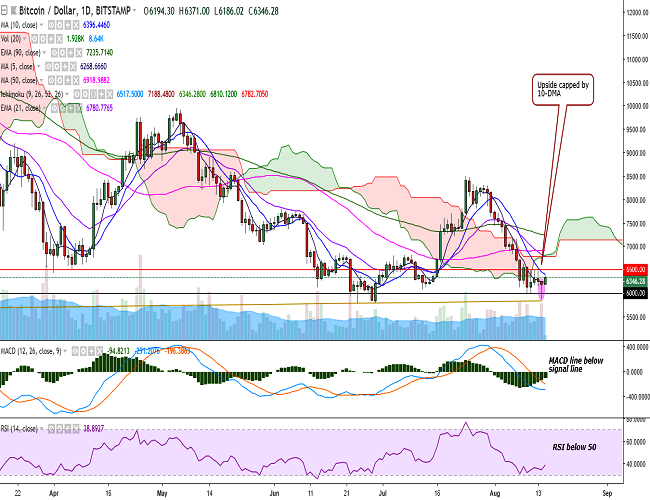
(Refer BTC/USD chart on Trading View)
BTC/USD closed at 6193 levels on Tuesday after hitting a low of 5880 levels, forming a hammer pattern.
The pair is currently trading at 6367 levels at the time of writing with its upside capped by 10-DMA (Bitstamp).
On the upside, the pair faces stiff resistance at 6393 (10-DMA) and a break above would see it testing 6497 (23.6% retracement of 8496.96 and 5880)/6600. Further strength would target 6701 (4h 90-EMA)/6782 (cloud bottom).
On the downside, support is likely to be found at 6233 (1h 100-SMA) and any violation would see it testing 6120 (June 13 low)/6000. Further weakness would drag the pair to 5880 (August 14 low)/5820 (trend line joining 5555.55 and 5774.72)/5780 (June 24 low).
On the daily chart, MACD line is below the signal line, while RSI is showing a turn from near oversold levels and stochs appear on the verge of a rollover from the oversold zone. In addition, the hammer pattern leaves open the scope for further upside.
Watch out for a decisive break above 6500 levels for minor bullishness in the pair.

- News

- Economy

- Central Banks
- Investing
- Research
- Roundups
- Digital Currency
- Insights
- Technical Analysis
- Technology
- Business
- Law
- Health
- Nature
- Fintech
- Science
- Topic
- Opinions
- ©Econometrics LLC . All Rights Reserved.
FxWirePro: BTC/USD likely to test 10-DMA resistance, break above 6500 to see minor bullishness
Wednesday, August 15, 2018 7:22 AM UTC
Editor's Picks


- Market Data
Most Popular


