


 FxWirePro- Major Crypto levels and bias summary
  Bitcoin Retreats as Geopolitical Tensions Flare: BTC/USD Dips Following Iran’s Rejection of Ceasefire
  FxWirePro- Major Crypto levels and bias summary
  Ethereum’s $2,200 Ceiling: Can Diplomatic Breakthroughs Dissolve the Bearish Resistance?
  Bitcoin Retreats Toward Critical Support as Geopolitical Winds Shift


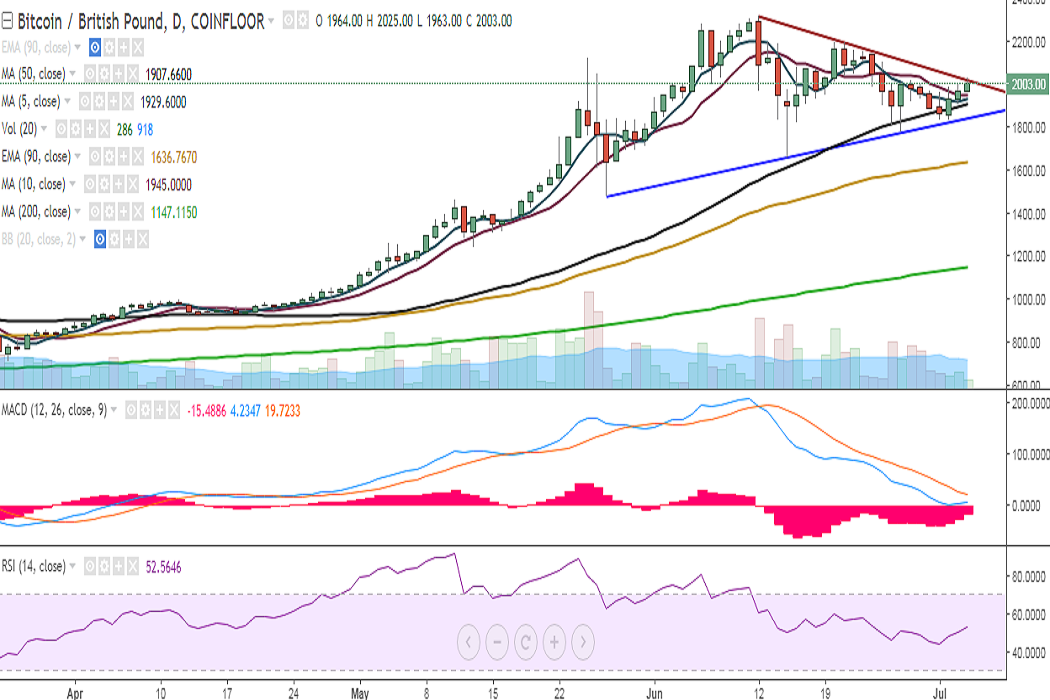
BTC/GBP broke above 10-DMA and is currently hovering around the trend line joining 2315 and 2193. It is currently trading at 2004 levels at the time of writing (Coinfloor).
Ichimoku analysis of daily chart:
Tenkan Sen: 1901
Kijun Sen: 1986
On the upside, a consistent break above 2015 (trend line joining 2315 and 2193) would see the pair testing 2063 (61.8% retracement of 2315 and 1657)/2118 (May 25 high). Further strength would see it soaring to 2193 (June 21 high)/2247 (113% retracement of 2193 and 1777).
On the flipside, support is likely to be found at 1945 (10-DMA) and any violation would drag it to 1907 (50-DMA)/1835 (trend line joining 1475 and 1657). Further weakness would target 1777 (June 27 low).
Momentum studies: On the daily chart, RSI is at 52 and stochs are biased higher. MACD appears to be on the verge of a bullish crossover.
On the weekly chart, the pair is trading just shy of 5-SMA and a break above would see further upside. RSI is at 60 and MACD line is above the signal line.
FxWirePro launches Absolute Return Managed Program. For more details, visit http://www.fxwirepro.com/invest

- News

- Economy

- Central Banks
- Investing
- Research
- Roundups
- Digital Currency
- Insights
- Technical Analysis
- Technology
- Business
- Law
- Health
- Nature
- Fintech
- Science
- Topic
- Opinions
- ©Econometrics LLC . All Rights Reserved.
FxWirePro: BTC/GBP hovers around major trend line resistance, further upside only on break above
Tuesday, July 4, 2017 9:49 AM UTC
Editor's Picks


- Market Data
Most Popular


