


 BTC Flat at $89,300 Despite $1.02B ETF Exodus — Buy the Dip Toward $107K?
  Elon Musk’s Empire: SpaceX, Tesla, and xAI Merger Talks Spark Investor Debate
  FxWirePro- Major Crypto levels and bias summary
  Nasdaq Proposes Fast-Track Rule to Accelerate Index Inclusion for Major New Listings


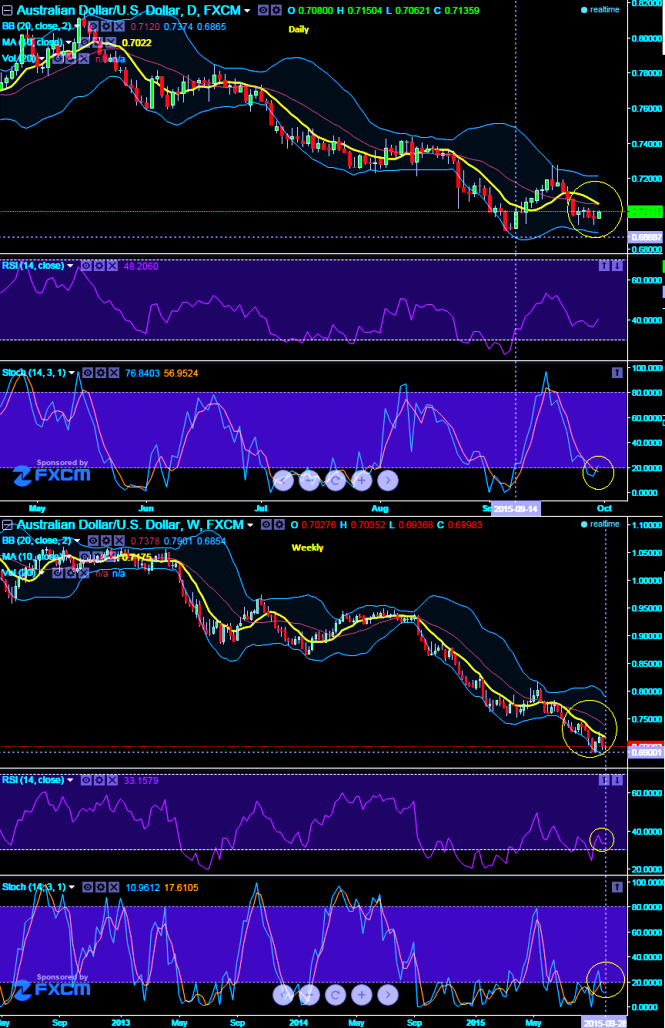
We would like to be dare devils in predicting bearish trend for AUDUSD in future, however short term rallies are on the cards. On weekly charts, prices remained well below moving average curve, while stochastic curve has reached below 20 but not signs of %K line crossover. RSI is also converging downwards with every weekly price drops. Observe circled areas for bearish indications, however these can never be studied in an isolation. Overall, momentum indicators are suggesting the prevailing downtrend looks rigorous, the major trend has been downtrend and initiate the below hedging recommendations in order to safeguard your currency exposure.
Before proceeding further please follow the below link that directs you as to what we've referred earlier.
http://www.econotimes.com/FxWirePro-Shooting-star-on-AUD-USD-%E2%80%93-BPS-for-hedging-92044
On daily charts, shooting star patterns at peaks which was recommended in our earlier post has shown their effects in daily charts as the pair began dropping its prices, and for now the short term uptrend looks quite likely event as both leading oscillators (RSI (14) and stochastic) today began diverging with previous price dips which short term recoveries are possible. While an attempt of %K crossover below 20 levels signifies oversold scenes on slow stochastic.
On a long term hedging perspective, debit put spreads are desirable. We recommend buying 1M 1% in the money puts and sell -1% out of the money put option of shorter expiry (preferably 3D or 5D). So buying In-The-Money Puts and to reduce the cost of hedging by financing this long position, selling an Out-Of-The-Money put option is recommended.

- News

- Economy

- Central Banks
- Investing
- Research
- Roundups
- Digital Currency
- Insights
- Technical Analysis
- Technology
- Business
- Law
- Health
- Nature
- Fintech
- Science
- Topic
- Opinions
- ©Econometrics LLC . All Rights Reserved.
FxWirePro: AUDUSD long term bearish trend remains robust despite Short term recoveries – stay firm with BPS
Wednesday, September 30, 2015 6:42 AM UTC
Editor's Picks


- Market Data
Most Popular


