


AUD/USD chart - Trading View
AUD/USD was trading largely muted after mixed Australian inflation data released earlier today.
Australia Q2 CPI flashed worrisome outcomes, headline Consumer Price Index (CPI) slipped from +0.3% prior to -1.9% on QoQ basis.
The RBA Trimmed Mean CPI fell to -0.1%, missing 0.1% forecasts and +0.5% previous readings.
The major has been on an upward spiral from the past 4 months and has broken above 21M EMA.
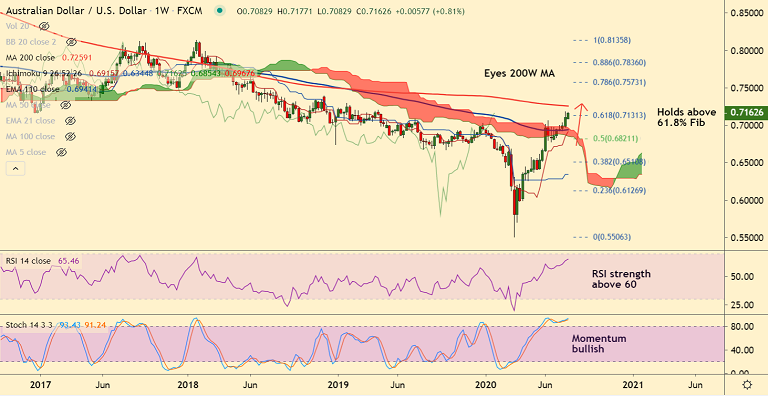
On the weekly charts the pair has broken above weekly cloud and is on track to test 200 W MA at 0.7259.
Selling pressure likely in the U.S. dollar likely amid continued coronavirus fears and expectations of a loose monetary policy from the Fed.
Decisive break above 200W MA could fuel further upside. Next major hurdle lies at 78.6% Fib at 0.7573.
Major Support Levels:
S1: 0.7133 (5-DMA)
S2: 0.7035 (21-EMA)
S3: 0.6941 (110W EMA)
Major Resistance Levels:
R1: 0.7259 (200W MA)
R2: 0.7353 (Upper W BB)
R3: 0.7573 (78.6% Fib)
Summary: Bias for the pair is strongly bullish. Pullbacks if any are likely to be shallow. Major weakness only below daily cloud or 200-DMA. Focus on FOMC interest rate decision for further impetus.


