


AUD/USD chart - Trading View
Spot Analysis:
AUD/USD was trading 0.24% lower on the day at 0.7358 at around 05:30 GMT.
Session High/ Low: 0.7481/ 0.7355
Previous Week's High/ Low: 0.7536/ 0.7359
Previous Session's High/ Low: 0.7431/ 0.7360
Fundamental Overview:
Australian dollar remains pressured towards 0.7350 despite hotter-than-expected China's inflation data.
China’s key inflation data for October released early Wednesday showed CPI, PPI both crossed market forecasts and prior readings.
China’s headline Consumer Price Index (CPI) rose past 1.4% market consensus and 0.7% previous readings to 1.5% YoY.
The Producer Price Index (PPI) refreshed a multi-month high with the 13.5% yearly figure compared to 12.4% expected and 10.7% prior.
Risk-off market mood, firmer US Treasury yields exert additional downside pressure on the pair.
Focus now on US inflation, stimulus headlines and risks from China property market for further impetus.
Technical Analysis:
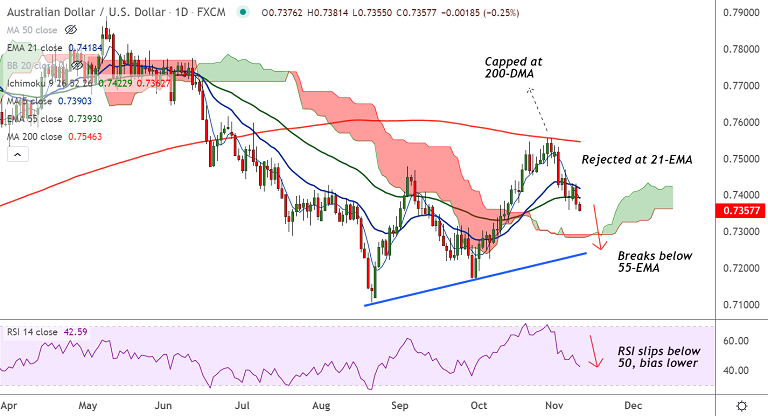
- AUD/USD recovery rejected at 21-EMA
- Price action drops below 55-EMA support
- Momentum is bearish, RSI is sharply lower and below the 50 mark
- MACD and GMMA indicator support weakness in the pair
Major Support and Resistance Levels:
Support - 0.7317 (110-week EMA), Resistance - 0.7393 (55-EMA)
Summary: AUD/USD bias turns bearish after rejected at 21-EMA. Scope for test of 110-week EMA at 0.7317.


