


Chart - Courtesy Trading View
Technical Analysis: Bias Bullish
GMMA Indicator
- Bearish on the daily charts
- Bullish on the hourly charts
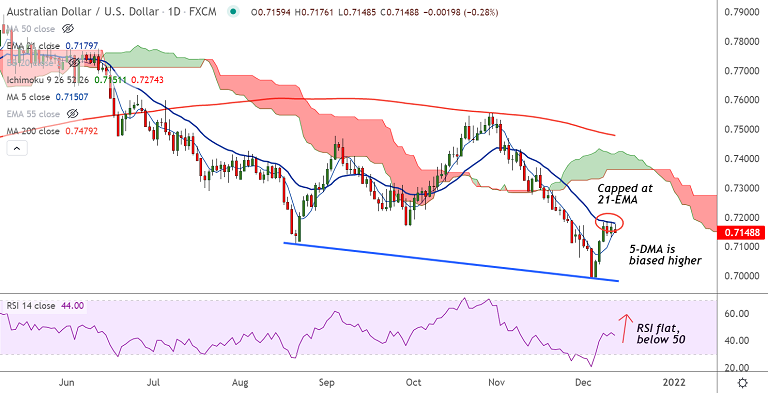
Ichimoku Analysis
- Price action is well below daily and weekly cloud
Oscillators
- Oscillators are biased lower on the weekly charts
- Stochs and RSI show bullish momentum on the daily charts
Bollinger Bands
- Bollinger bands are wide, show high volatility
Major Support Levels: 0.7151 (5-DMA), 0.7111 (200H MA)
Major Resistance Levels: 0.7180 (converged 200-week MA and 21-EMA), 0.7265 (55-EMA)
Summary: AUD/USD is grinding sideways below 21-EMA resistance for the past 4 sessions. Technical bias is tilted bullish, decisive break above 200-week MA will fuel further gains.


