


AUD/USD chart - Trading View
Technical Analysis:
GMMA Indicator - Bearish
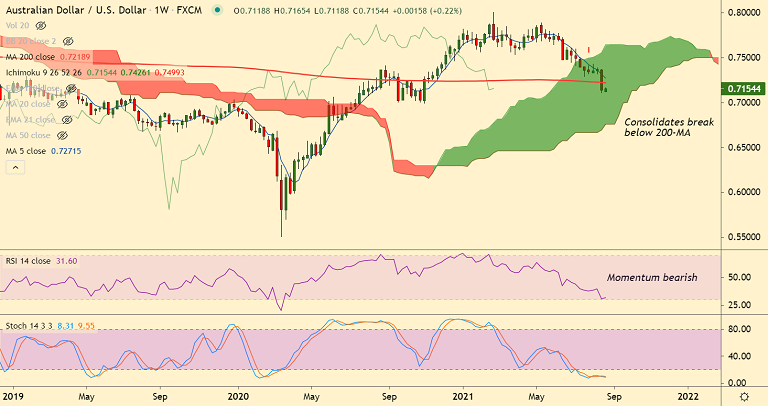
Ichimoku Analysis - Bearish
Oscillators - At oversold
Bollinger Bands - High volatility
Fundamental Overview:
Risk appetite improves with global equities and higher US benchmark Treasury yields supporting the Aussie.
Australia’s Commonwealth Bank Manufacturing Purchasing Managers Index ( PMI) for August slipped to 51.7 from 56.9 in the previous month and missed estimates at 56.7.
The Services Purchasing Managers Index ( PMI) for August was down to 43.3 from 44.2 in the previous month and missed estimates at 44.
Major Support Levels: 0.71, 0.7051 (38.2% Fib), 0.70
Major Resistance Levels: 0.7184 (5-DMA), 0.72, 0.7218 (200-week MA)
Summary: AUD/USD is consolidating previous week's break below 200-week MA. Price action is showing some retracement from multi-week lows. The pair has bounced off with a spinning top formation. However, recovery lacks traction, upside is likely to be limited.


