


AUD/NZD chart - Trading View
Technical Analysis: Bias Bullish
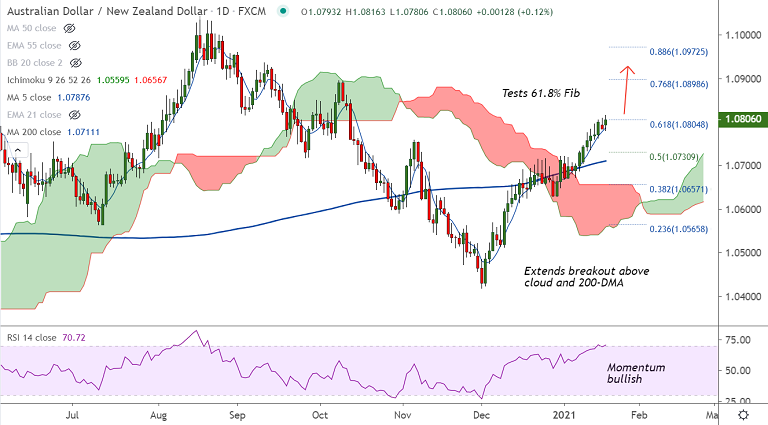
- Price has edged above cloud and major moving averages
- Bollinger bands are widening, suggests rising volatility
- Oscillators (Stochs and RSI) show momentum is strongly bullish
- Analysis of GMMA indicator shows minor trend is bullish, while major trend is turning bullish
- MACD and ADX also support upside, MACD shows bullish crossover on signal line on the weekly charts
Support levels - 1.0788 (5-DMA), 1.0752 (200H MA), 1.0730 (50% Fib)
Resistance levels - 1.0865 (Nov 2019 high), 1.0898 (76.8% Fib), 1.09
Summary: Aussie remains bid across the board after upbeat Australian data. Risk-on mood also supports antipodeans. AUD/NZD trades with a strong bullish bias. Price action has edged above 61.8% Fib and is on track to test 76.8% Fib at 1.0898.


