AUD/NZD chart - Trading View
AUD/NZD was trading 0.21% higher on the day at 1.0795 at around 10:00 GMT.
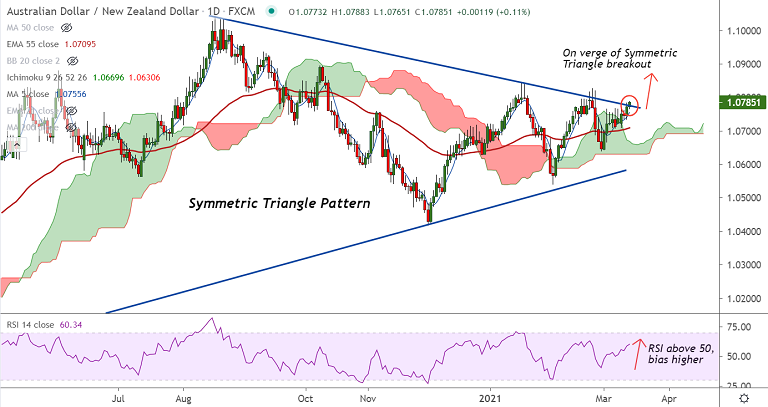
The pair has resumed upside momentum and is on track for further gains.
Price action has broken out of daily cloud and is on verge of Symmetric Triangle breakout.
Oscillators show momnetum is strongly bullish. Stochs and RSI are biased higher. RSI is above 50 and supports the uptrend.
Analysis of GMMA indicator shows major and minor trend are strongly bullish on the intraday charts.
Volatility is also rising as evidenced by widenining Bollinger bands. MACD shows a bullish crossover on signal line.
The pair is on track to test 1.0820 (trendline). Break above finds little resistance till 110-month EMA at 1.0963.


FxWirePro- Woodies Pivot(Major)
AUDJPY Bulls in Control: Buy the Dips Above 103.80 for a Run Towards 106
FxWirePro: USD/CNY hits 15-month low , scope for further downside
FxWirePro: GBP/AUD tracks lower on firmer Australian dollar
FxWirePro: EUR/NZD set for bigger drop, but close below key fibo needed
FxWirePro: USD/CAD outlook weaker on renewed downside pressure
FxWirePro: EUR/AUD attracts selling interest, vulnerable to more downside
CAD/JPY Holds Positive Bias Despite Canada’s Sharp GDP Contraction: Buy Dips Toward 116 Target
FxWirePro- Major Pair levels and bias summary
NZDJPY: Sell the Rallies as Bears Guard 92 and Range Trade Persists
FxWirePro: EUR/CAD extends fall, vulnerable to more downside
FxWirePro: USD/JPY extends falls as Japanese yen extends rally after hawkish BoJ minutes
FxWirePro: EUR/AUD slips following RBA minutes , plunge to test a key fibo grows
FxWirePro: AUD/USD gaining momentum for a move towards 0.6800 level 


