


AUD/JPY chart - Trading View
Technical Analysis: Bias Bearish
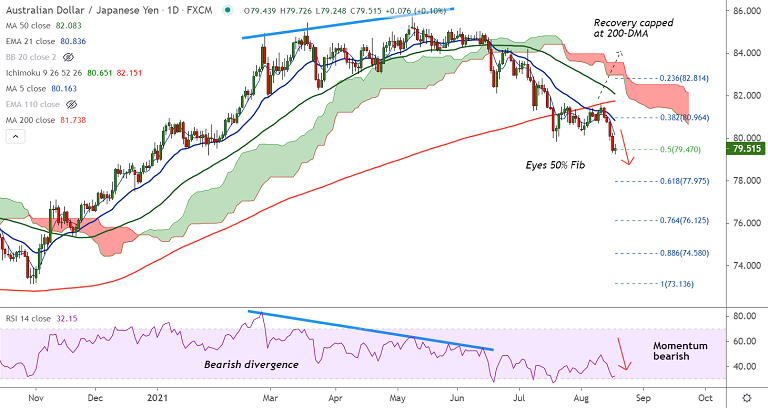
- AUD/JPY pauses after 4 straight sessions of downside
- The pair has formed a Doji on the daily candle at 50% Fib support
- Momentum is bearish, Stochs and RSI are sharply lower
- GMMA indicator shows major and major trend are strongly bearish
- Volatility is high and rising on the weekly and daily charts
Support levels - 79.47 (50% Fib), 78.61 (200-week MA), 77.97 (61.8% Fib)
Resistance levels - 80.16 (5-DMA), 80.83 (21-EMA), 81.73 (200-DMA)
Summary: AUD/JPY trades with a strong bearish bias. Scope for dip till 61.8% Fib at 77.97. Bearish invalidation only above 200-DMA.


