


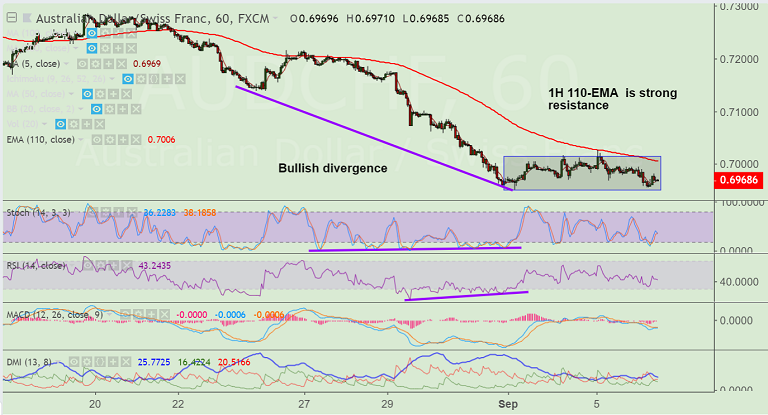
AUD/CHF chart on Trading View used for analysis
- AUD/CHF is extending sideways grind, hovers around 5-DMA at 0.6980.
- Downtrend in the pair is intact on the weekly charts, but we see some upside on the intraday charts.
- Price action is moving away from the lower Bollinger Band on the daily charts.
- Further we see bullish divergence on RSI and Stochs on the hourly charts which raises scope for some upside.
- 1H 110-EMA offers stiff resistance at 0.7007, break above will see further upside. Test on 21-EMA at 0.7131 then likely.
- On the flip side, failure at 5-DMA (0.6981) and close below will see resumption of weakness.
Support levels - 0.6981 (5-DMA), 0.69, 0.6805 (78.6% Fib), 0.6752 (Feb 2016 low)
Resistance levels - 0.7007 (1H 110-EMA), 0.7020 (61.8% Fib), 0.7131 (21-EMA)
FxWirePro Currency Strength Index: FxWirePro's Hourly AUD Spot Index was at -48.9373 (Neutral), while Hourly CHF Spot Index was at 55.2632 (Neutral) at 1100 GMT. For more details on FxWirePro's Currency Strength Index, visit http://www.fxwirepro.com/currencyindex.


