


LTC/USD chart - Trading View
Exchange - Coinbase
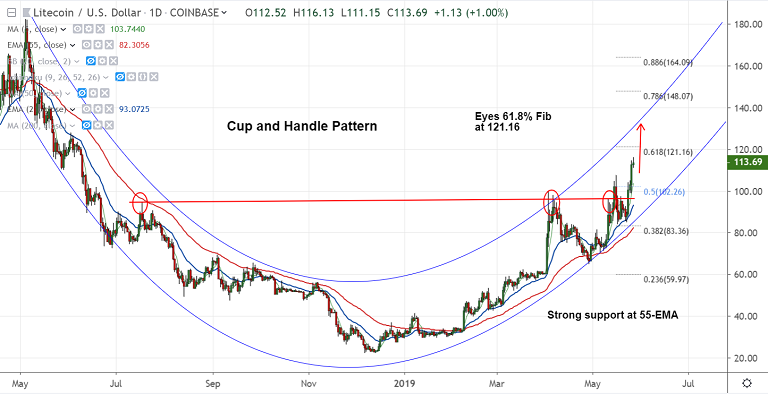
Support: 110 (trendline); Resistance: 121.16 (61.8% Fib)
Technical Analysis: Bias Bullish
LTC/USD extends gains, trades 1.38% higher at 114.31 at 10:35 GMT.
The pair has broken above major trendline resistance at 110, bias higher.
Volatility is rising, momentum is with the bulls, RSI is above 70, bias higher.
Price action extends gains in a 'Cup and Handle' pattern. Next bull target lies at 61.8% Fib at 121.16.
55-EMA is major support at 82.33. Bullish invalidation below 200-DMA.
For details on FxWirePro's Currency Strength Index, visit http://www.fxwirepro.com/currencyindex.


