


 Ethereum’s $2,200 Ceiling: Can Diplomatic Breakthroughs Dissolve the Bearish Resistance?
  FxWirePro: USD/CAD remains buoyant, looks to extend gains
  FxWirePro:NZD/USD treads water as Iran uncertainty keeps traders on edge
  Sterling’s Steady Ascent: GBPJPY Tests the 213.31 Resistance Amid a Two-Week Consolidation
  FxWirePro- Major Crypto levels and bias summary
  BTCUSD Coils in Tight Range: Will Geopolitical Stability Trigger a Breakout Toward $80,000?
  Ethereum Steady Above USD 2,000: ETH Tracks Bitcoin’s Lead as Bulls Eye a USD 2,770 Breakout
  FxWirePro: GBP/AUD edges lower, downside risk remains
  FxWirePro:NZD/USD edges lower, bearish outlook persists


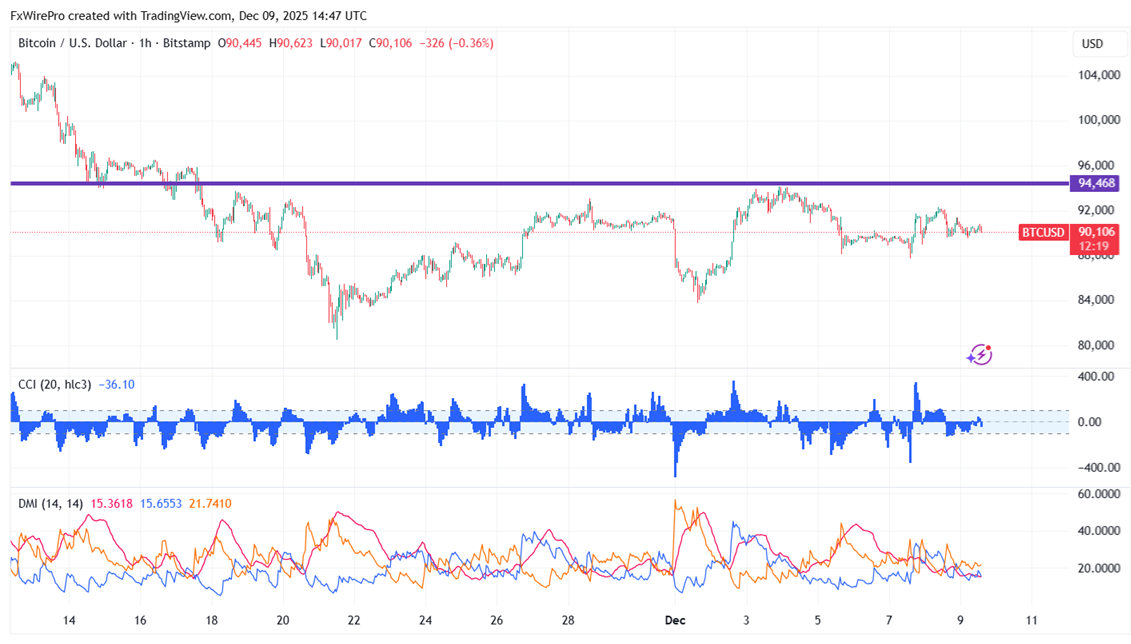
BTCUSD trades flat with positive bias. It hit a high of $92296 yesterday, and at the moment, it is around $90237.
Oscillators and moving averages to forecast the trend of BTCUSD
CMP- $90221
EMA (1-hour chart)
55-EMA- $92020
200-EMA- $90772
365-EMA- $91156. The pair trades above the short and long-term moving averages.
Major Support - $90000. Any breach below $90000 will drag the pair down to $86000/$83000/$80000.
Major Resistance - $92500. Any break above $9250 confirms minor bullishness, a jump to $93000/$93500/$94500/$95415/$97400/$98500/$10000.
Indicators (60-min chart)
CCI(50)- Neutral
ADX- Neutral
5. Investment Strategy for BTCUSD
It is good to buy on dips around $90000 with a stop loss around $86000 for target profits of $100000/$107000.


