


 FxWirePro: GBP/NZD runs out of steam but maintains bullish outlook
  FxWirePro: USD/JPY uptrend loses steam, remains on bullish path
  FxWirePro- Major Crypto levels and bias summary
  FxWirePro: AUD/USD edges higher but bearish outlook persists
  FxWirePro: USD/JPY edges up, looks to extend gains
  FxWirePro: USD/CNY edges up as yuan weakens on firmer dollar
  AUDJPY Stalls in Neutral Ground: Bearish Shadows Loom Over the 111.00 Mark
  NZDJPY in Consolidation: Navigating the 92.00 Range as Bearish Clouds Gather
  FxWirePro: GBP/USD drifts lower , could be on verge of bigger drop
  FxWirePro: USD/CAD remains buoyant, looks to extend gains
  Ethereum’s $2,200 Ceiling: Can Diplomatic Breakthroughs Dissolve the Bearish Resistance?
  Ethereum Steady Above USD 2,000: ETH Tracks Bitcoin’s Lead as Bulls Eye a USD 2,770 Breakout
  FxWirePro: EUR/ NZD stuck in range but maintains bullish bias


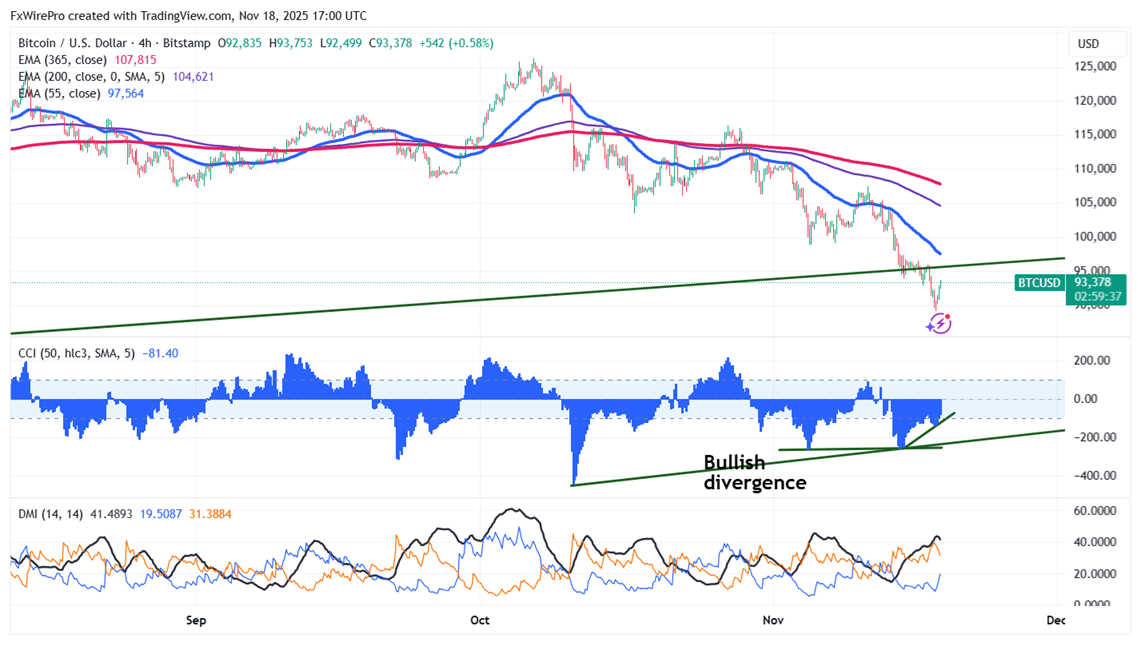
Chart pattern - Bullish divergence in CCI(50)- Both 4-hour and Daily charts.
The CCI line crosses back over the -100 level from the oversold area, confirming that the upward movement is actually taking shape.
Technical Analysis: Key Levels to Watch for BTC/USD
BTC/USD recovered after a minor decline below $90000. The pair hits an intraday high of $93753 and is currently trading around $93434.
It trades below short-term (34-EMA and 55-EMA) and long-term (200 and 365-EMA) moving averages on the 4-hour chart. Minor support is around $92800; breaking below this would drag the pair down to $89000/$86500/$80000. Immediate resistance is around $96000 indicates that closing above this level could lead to targets $10000/$105900/$108000/$115000/$120000/$126500.
Investment Strategy: Opportunities for Traders
Indicators (4-hour chart).
CCI(50)- Bearish
Directional movement index - Neutral
It is good to buy on dips around $92000 with a stop-loss set at $86500 for a TP of $115000/$120000.


