


 Ethereum Steady Above USD 2,000: ETH Tracks Bitcoin’s Lead as Bulls Eye a USD 2,770 Breakout
  FxWirePro- Major Crypto levels and bias summary
  FxWirePro: AUD/USD downside pressure builds, key support level in focus
  FxWirePro: GBP/AUD idles around 1.9230 as market awaits fresh catalysts
  FxWirePro: EUR/AUD neutral in the near-term, scope for downward resumption
  FxWirePro: USD/JPY edges up, looks to extend gains
  AUDJPY Stalls in Neutral Ground: Bearish Shadows Loom Over the 111.00 Mark
  Bitcoin Surges Past USD 70,000 as Trump Signals De-escalation in US-Iran Conflict
  FxWirePro- Major Pair levels and bias summary
  FxWirePro: AUD/USD edges higher but bearish outlook persists
  FxWirePro: USD/JPY uptrend loses steam, remains on bullish path
  BTCUSD Coils in Tight Range: Will Geopolitical Stability Trigger a Breakout Toward $80,000?


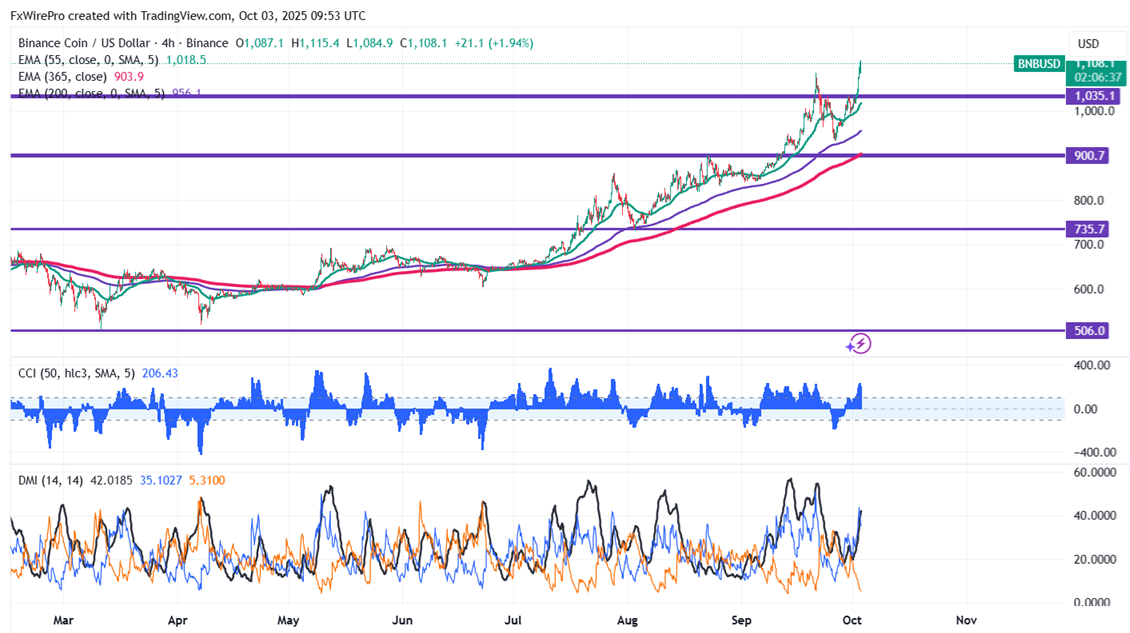
BNBUSD hits a fresh all-time high on positive developments. It hit a fresh all-time high of $1115 and is currently trading around $1109.60.
Oscillators and moving averages to forecast the trend of BNBUSD
CMP- $1109.90
EMA (4-hour chart)
55-EMA- $1015
200-EMA- $954.60
365-EMA- $902.70. The pair trades above the short and long-term moving averages.
This week week low- $993.80 (Sep 30th low). Any breach below $990 will drag the pair down to $950/$930/$889/$870/$830. Near-term support $1050.
This week high- $1115 (Oct 3rd high). Any break above $1129 (127.20% fib) confirms minor bullishness, a jump to $1183/$1200 is possible.
Indicators (4-hour chart)
CCI(50)- Bullish
ADX- above 20 showing bullish bias
5. Investment Strategy for BNBUSD
It is good to buy on dips around $980 with a stop loss around $930 for target profits of $1100.


