


 FxWirePro- Major Crypto levels and bias summary
  FxWirePro- Major Crypto levels and bias summary
  BTC’s Bear Bounce: Sell the Rally Near $66K as Bears Target $59K–$52K Breakdown
  FxWirePro- Major Crypto levels and bias summary
  Ethereum Cracks Under $1,700: Sell the Rally Near $1,750 as Bears Eye $1,380–$1,200


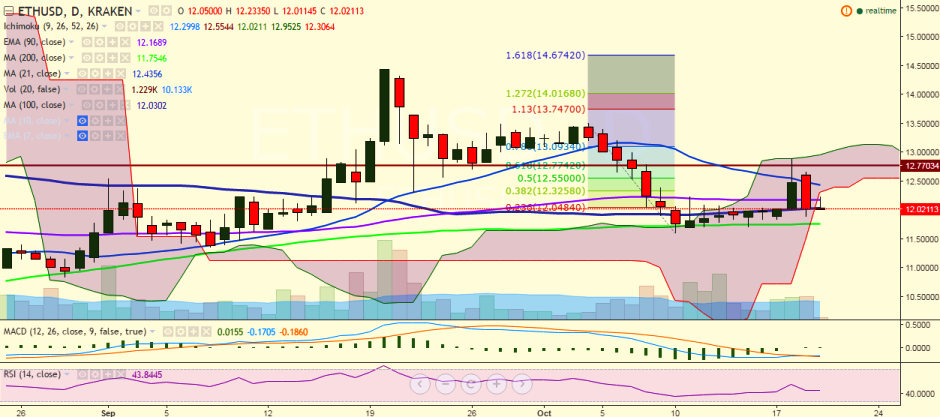
ETH/USD broke below the 12.00 level on Wednesday before closing at 12.03 levels. Today, the pair is trading at 12.02 levels as it faces strong resistance at 90 EMA.
Ichimoku analysis of daily chart:
Tenkan Sen: 12.29
Kijun Sen: 12.55
Trend reversal: 12.17 (90 EMA)
“The pair’s upside seems to be capped by 61.8% retracement of 13.50 and 11.60. It must break above October 18 high of 12.89 levels for further upside”, FxWirePro said in a statement.
On the topside, major resistance is seen at 12.17 (90 EMA) and a break above would target 12.77 (61.8% retracement of 13.50 and 11.60)/12.89 (October 18 high).
On the reverse side, 12.01 (100-day MA) is acting as a major support for the pair. Any breach of this level would take it to 11.75 (200-day MA)/11.60 (October 10 low).

- News

- Economy

- Central Banks
- Investing
- Research
- Roundups
- Digital Currency
- Insights
- Technical Analysis
- Technology
- Business
- Law
- Health
- Nature
- Fintech
- Science
- Topic
- Opinions
- ©Econometrics LLC . All Rights Reserved.
ETH/USD trades below 90-EMA, bullishness only above 12.89
Thursday, October 20, 2016 10:17 AM UTC
Editor's Picks


- Market Data
Most Popular


