


 FxWirePro- Major Crypto levels and bias summary
  Ethereum Cracks Under $1,700: Sell the Rally Near $1,750 as Bears Eye $1,380–$1,200
  FxWirePro- Major Crypto levels and bias summary


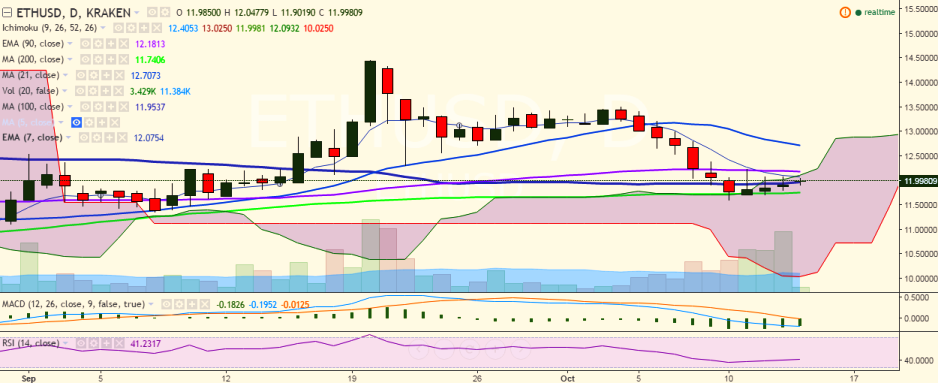
ETH/USD is consolidating gradually in a narrow range and is hovering around 100-day MA. It is currently trading at 11.99 levels (Kraken).
Long-term trend: Bullish
Short-term trend: Bullish
Ichimoku analysis of daily chart:
Tenkan Sen: 12.50
Kijun Sen: 13.02
Trend reversal: 12.18 (90 EMA)
“The pair is trading above 11.73 (200-day MA) and struggling to close above11.93 (100-day MA) from past couple of days. Bullishness in the pair would be seen only if it breaks above the previous high of 12.23 levels”, FxWirePro said in a statement.
Major resistance is seen at 12.18 (90 EMA) and any violation would send the pair 12.76 (21-Day MA)/13.50 (October 04 high).
On the downside, support is likely to be found at 11.73 (200-DMA) and a break below would target 11.60 levels (October 10 low)/11.35 (September 08 low).

- News

- Economy

- Central Banks
- Investing
- Research
- Roundups
- Digital Currency
- Insights
- Technical Analysis
- Technology
- Business
- Law
- Health
- Nature
- Fintech
- Science
- Topic
- Opinions
- ©Econometrics LLC . All Rights Reserved.
ETH/USD gradually moving upwards, break above 12.23 confirms bullishness
Friday, October 14, 2016 11:03 AM UTC
Editor's Picks


- Market Data
Most Popular


