


 BTC’s Bear Bounce: Sell the Rally Near $66K as Bears Target $59K–$52K Breakdown
  FxWirePro- Major Crypto levels and bias summary
  FxWirePro- Major Crypto levels and bias summary
  Ethereum Cracks Under $1,700: Sell the Rally Near $1,750 as Bears Eye $1,380–$1,200


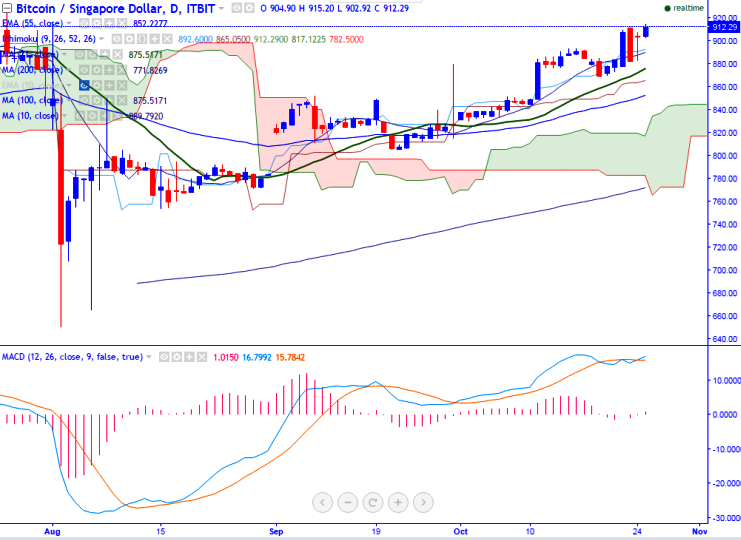
BTC/SGD pair has broken the high 893.66 made on Oct 15th, 2016 high and jumped till 909.66 levels (ITBIT). It is currently trading around 905.95 at the time of writing.
Ichimoku analysis of daily chart shows:
Tenkan-Sen level: 890.73
Kijun-Sen level: 863.32
Trend reversal level - (100 days MA) – 872.01
Long-term trend remains to be bullish. The pair struggles to close below 10- day MA and any minor weakness can be seen only below that level.
Major resistance is around 909.66 (Oct 22nd high) and any violation above will take the pair till 925 (Jul 26th high)/944 (Jul 2nd, 2016 high). Short-term support is seen at 882 (23.6% retracement of 805.01 and 909.66) and any break below targets 872 (21- day MA)/ 850 (55- day EMA).

- News

- Economy

- Central Banks
- Investing
- Research
- Roundups
- Digital Currency
- Insights
- Technical Analysis
- Technology
- Business
- Law
- Health
- Nature
- Fintech
- Science
- Topic
- Opinions
- ©Econometrics LLC . All Rights Reserved.
BTC/SGD trades well above 900 level, jump till 944 likely
Tuesday, October 25, 2016 11:34 AM UTC
Editor's Picks


- Market Data
Most Popular


