


 FxWirePro- Major Crypto levels and bias summary
  FxWirePro- Major Crypto levels and bias summary


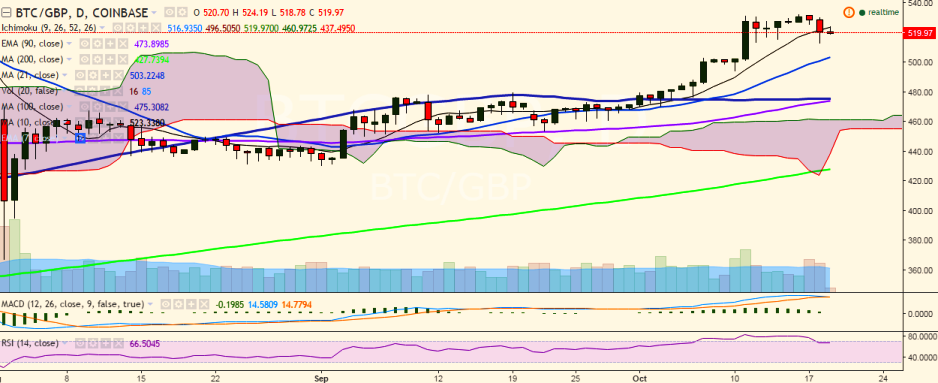
BTC/GBP is moving south after hitting a high of 532.69 on October 16. It has slipped below 10-day MA and is currently trading at 519.98 levels at the time of writing (Coinbase).
Long-term trend: Bullish
Ichimoku analysis of daily chart:
Tenkan Sen: 513.34
Kijun Sen: 495.49
Trend reversal: 472.86 (90 EMA)
On the upside, the pair faces immediate resistance at 521.41 (10-day MA) and break above would target 532.69 (October 16 high). Further strength would confirm bullishness in the pair and see it testing 544.88 (161.8% retracement of 532.69 and 512.96).
On the flipside, the pair has taken support around 515 levels and a break below would target 500 (21-day MA)/475 (100-day MA).

- News

- Economy

- Central Banks
- Investing
- Research
- Roundups
- Digital Currency
- Insights
- Technical Analysis
- Technology
- Business
- Law
- Health
- Nature
- Fintech
- Science
- Topic
- Opinions
- ©Econometrics LLC . All Rights Reserved.
BTC/GBP slips below 10-DMA, further bullishness only above 532
Wednesday, October 19, 2016 11:37 AM UTC
Editor's Picks


- Market Data
Most Popular


