


 AUDJPY Bullish Surge: Strong Australian Dollar Fuels Fresh Upside as Pair Holds Above 113.50 and All EMAs Align
  Crypto Major Pair Action Bias: ETHUSD Bullish as BTCUSD, SOLUSD & XRPUSD Stay Neutral
  ETH Stands Alone Bullish; BTC, SOL, XRP, BNB Neutral
  FxWirePro:EUR/NZD dips below lower range, bearish bias increases
  NZDJPY Bullish Surge: Strong Kiwi Ignites Fresh Upside as 94 Support Holds and All EMAs Align
  FxWirePro- Woodies pivot (Major)
  FxWirePro- Major Crypto levels and bias summary
  Gold Loses Steam After Strong U.S. Retail Sales
  FxWirePro- Major Crypto levels and bias summary
  GBPUSD, AUDUSD & NZDUSD Turn Extremely Bullish: Strong Positive Momentum Drives Major Pair Action Bias
  FxWirePro: GBP/NZD gains some upside momentum but still bearish
  FxWirePro- Major Crypto levels and bias summary
  FxWirePro: NZD/USD trades in narrow range ,outlook bullish
  FxWirePro- Major Crypto levels and bias summary


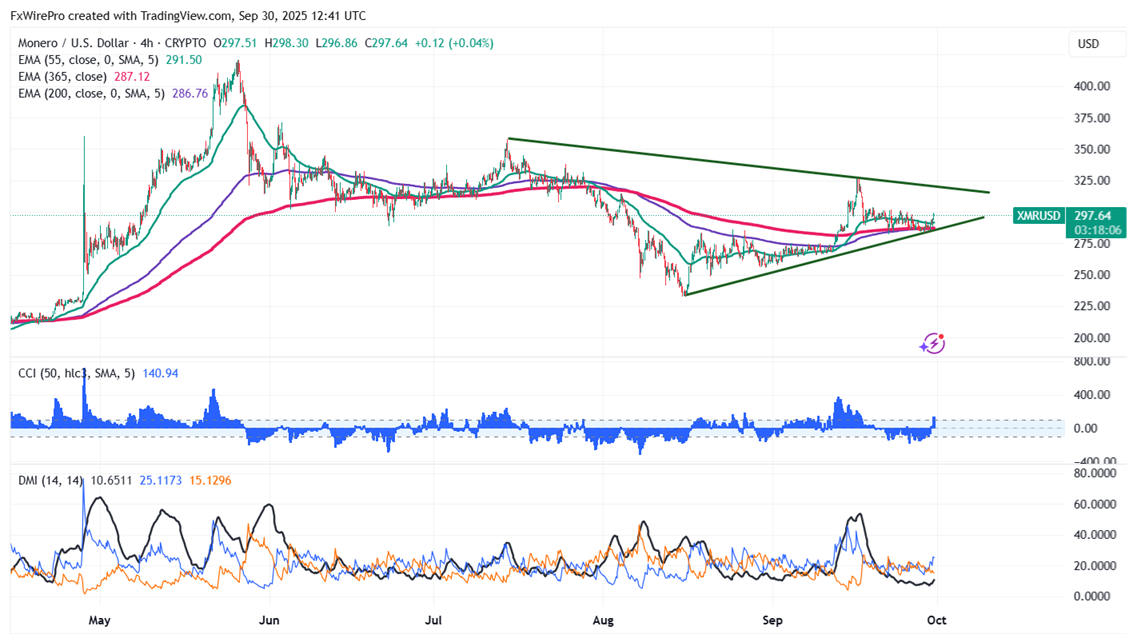
XMRUSD showed a pullback after a minor sell-off from the temporary top $326. It hits an intraday high of $299.53 and is currently trading around $297.86.
Oscillators and moving averages to forecast the trend of XMR
CMP- $297.72
EMA (4-hour chart)
55-EMA- $291.27
200-EMA- $286.65
365-EMA- $287.07. The pair trades above the short and long-term moving averages.
Previous week low- $282.40 (Sep 22nd low). Any breach below $280 will drag the pair down to $268.50/$253.
Previous week high- $302 (Sep 22nd high). Any break above $302 confirms minor bullishness, a jump to $310/321 (trend line joining $357.59 and 326.89)/$326.89 (Sep 16th high)/$357.59 (Jul 14th high).
Indicators (4-hour chart)
CCI(50)- Bullish
ADX- above 20 showing neutral bias
Investment Strategy for XMRUSD
It is good to buy on dips around $291-92 with a stop loss around $280 for target profits of $326/$357.


