


 Oil Price Forecasts Rise for 2026 as Middle East Supply Risks Persist


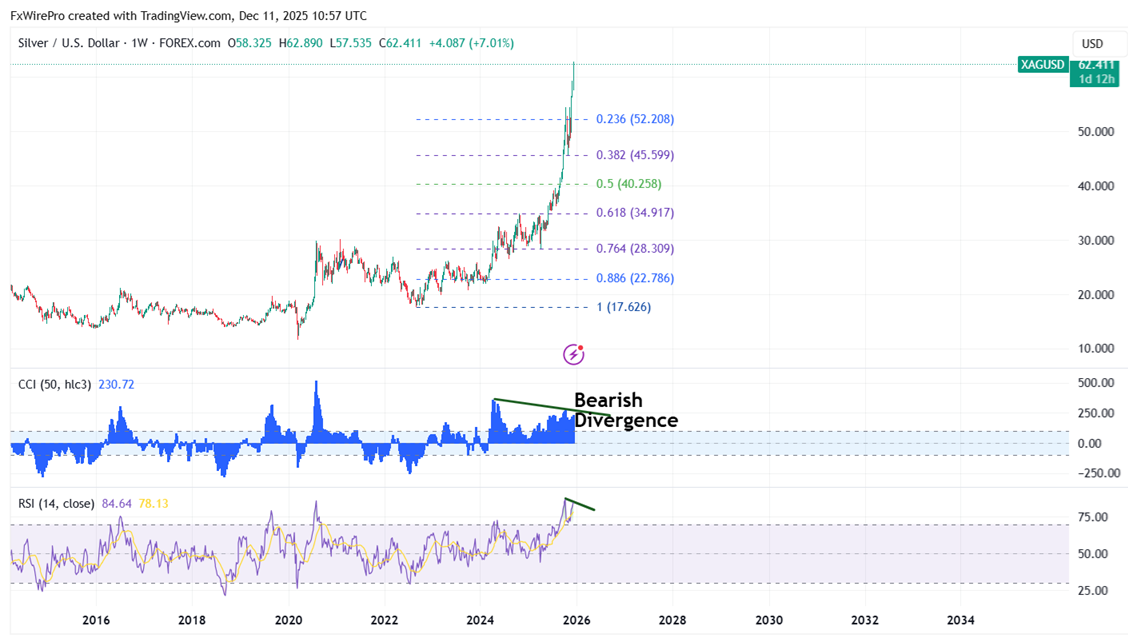
Silver hits a fresh high after the Fed cuts rates by 25 bps. It hit an intraday high of $62.89 and is currently trading around $62.25.
Chart pattern- Bearish divergence (CCI(50) and RSI(14) in weekly chart)
Gold-to-silver ratio and purchasing discipline
At present, the gold/silver ratio is roughly 69:1 (gold ~$4,200 oz, silver ~60.5 oz), near to its long-term average and barely beneficial to silver. Historically, real "screaming buy" chances for silver have shown themselves when the ratio surges above 80–90; ratios below 60 have typically indicated coming gold outperformance. Most seasoned analysts recommend waiting for either a significant price correction in silver (10–15% retests of past resistance-turned-support) or a ratio increase back toward 75–80 before aggressively adding exposure, rather than chasing the current momentum highs since silver is already having a good year.
Silver's Structural Bull Case Remains Improving
Driving the market into its fifth straight year of structural deficit in 2024–2025, industrial demand has become the main driver, accounting for practically 60% of overall silver consumption (up from around 50% a decade ago). While EVs, charging infrastructure, 5G, AI data centers, semiconductors, and medical applications are layer new layers of demand, solar PV alone has grown 130–140% from 2016 and is still quickly growing. Above-ground stockpiles are still drawn down as demand is predicted at over 1.1 billion ounces against a supply of only 1.0–1.03 billion ounces, therefore confirming silver's growing use as both a vital green- and high-tech metal and a traditional monetary hedge.
Trading Strategy and Key Levels for Silver
The commodity is trading above the short-term (34 and 55 EMA) and long-term moving average (200 and 365 EMA) in the weekly chart. The near-term support is around $61.40, and any violation below will drag the commodity to $60.75/$60/$58.75/$56.16/$55/$54.14/$52/$50. The immediate resistance is at $63; any breach above targets $65/$68.71/$70.
It is good to buy on dips around $54 with a stop-loss at $50 for a TP of $65/$68.70/$70.


