


 FxWirePro- Major Pair levels and bias summary
  FxWirePro:EUR/NZD extends fall, key support lies ahead
  FxWirePro: NZD/USD steadies around 0.5830,retains bid tone
  AUDJPY Bullish Surge: Strong Australian Dollar Fuels Fresh Upside as Pair Holds Above 113.50 and All EMAs Align
  GBPJPY Bullish Surge: Strong Pound Ignites Fresh Upside on Fed-BOE Policy Divergence as All EMAs Align
  GBPUSD, AUDUSD & NZDUSD Turn Extremely Bullish: Strong Positive Momentum Drives Major Pair Action Bias
  FxWirePro: AUD/USD edges lower, but bullish outlook persists
  FxWirePro: NZD/USD trades in narrow range ,outlook bullish
  ETH Stands Alone Bullish; BTC, SOL, XRP, BNB Neutral
  FxWirePro:EUR/NZD dips below lower range, bearish bias increases
  AUDJPY Extremely Bullish Above 113: Strong AUD Fuels Fresh Rally – Buy Dips at 113 Targeting 115
  FxWirePro- Major Crypto levels and bias summary
  FxWirePro :USD/JPY bulls loosen their grip a bit, dips to be bought
  FxWirePro: GBP/NZD gains some upside momentum but still bearish
  NZDJPY Bullish Surge: Strong Kiwi Ignites Fresh Upside as 94 Support Holds and All EMAs Align


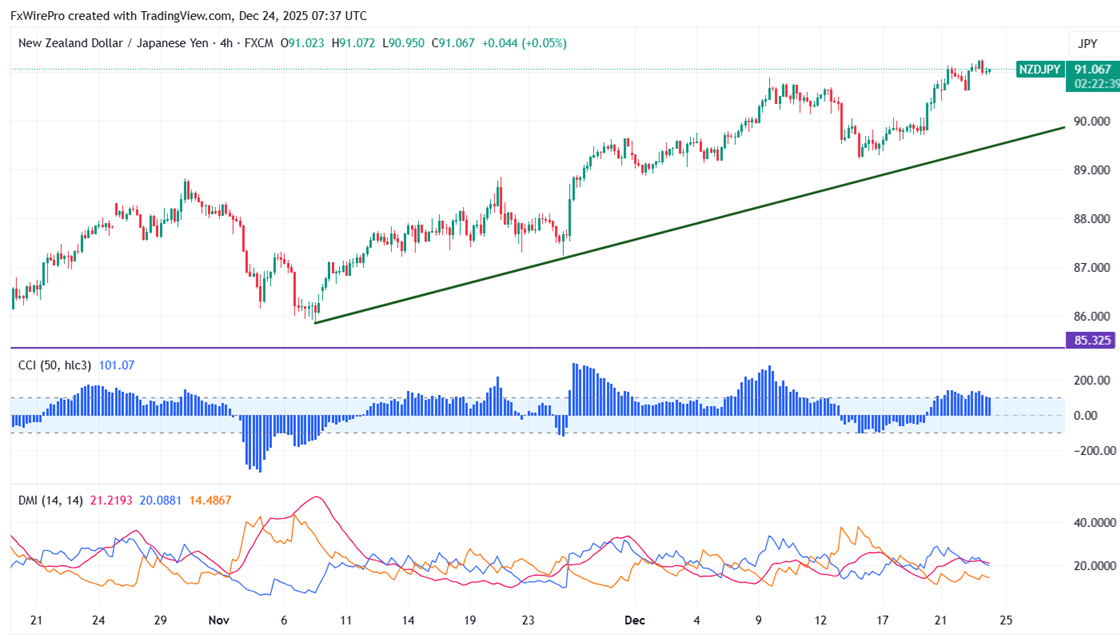
NZDJPY traded in a narrow range between 89.22 and 91.25 for the past four days. The intraday trend is bearish as long as the resistance at 92 lasts. The pair reached an intraday high of 91.25; it presently trades around 91.05.
Oscillators and moving averages to forecast the trend of NZDJPY
CMP- 91.05
EMA (4-hour chart)
55-EMA- 90.34
200-EMA- 89.28
365-EMA- 88.61. The pair trades above the short (55 EMA) and long-term moving average(200 and 365).
Major support- 90.45. Any breach below will drag the pair down to 90/89.70/89.20/88.70/88.40/87.99.
Major resistance - 91.50. Any break above 91.50 confirms minor bullishness, a jump to 92/93.
Indicator (4-hour chart)
CCI (50)- bullish
Average directional movement Index- Neutral. All indicators confirm a mixed trend.
It is good to sell on rallies around 91.38-40 with SL around 92 for TP of 89.20.


