


 FxWirePro- Woodies pivot (Major)
  FxWirePro: GBP/NZD gains some upside momentum but still bearish
  EUR/USD Holds Bullish Tone Despite Pullback from Yesterday’s High
  FxWirePro- Major Crypto levels and bias summary
  JPY Action Bias: Extremely Bullish Surge Ignites Across NZD, GBP & AUD
  FxWirePro: NZD/USD trades in narrow range ,outlook bullish
  GBPJPY Bullish on Consolidation: Holds Above 216 After 218 Top – Buy Dips at 217 Targeting 220
  ETH Stands Alone Bullish; BTC, SOL, XRP, BNB Neutral
  FxWirePro: GBP/USD hits one-month high, scope for further upside
  FxWirePro:EUR/NZD dips below lower range, bearish bias increases
  FxWirePro :USD/JPY bulls loosen their grip a bit, dips to be bought
  FxWirePro: AUD/USD edges lower, but bullish outlook persists
  Major Pair Action Bias: Extremely Bullish Surge Powers GBPUSD & NZDUSD as Bullish Momentum Ignites
  FxWirePro: AUD/USD remains buoyant, looks to extend gains
  GBPJPY Bullish Surge: Strong Pound Ignites Fresh Upside on Fed-BOE Policy Divergence as All EMAs Align


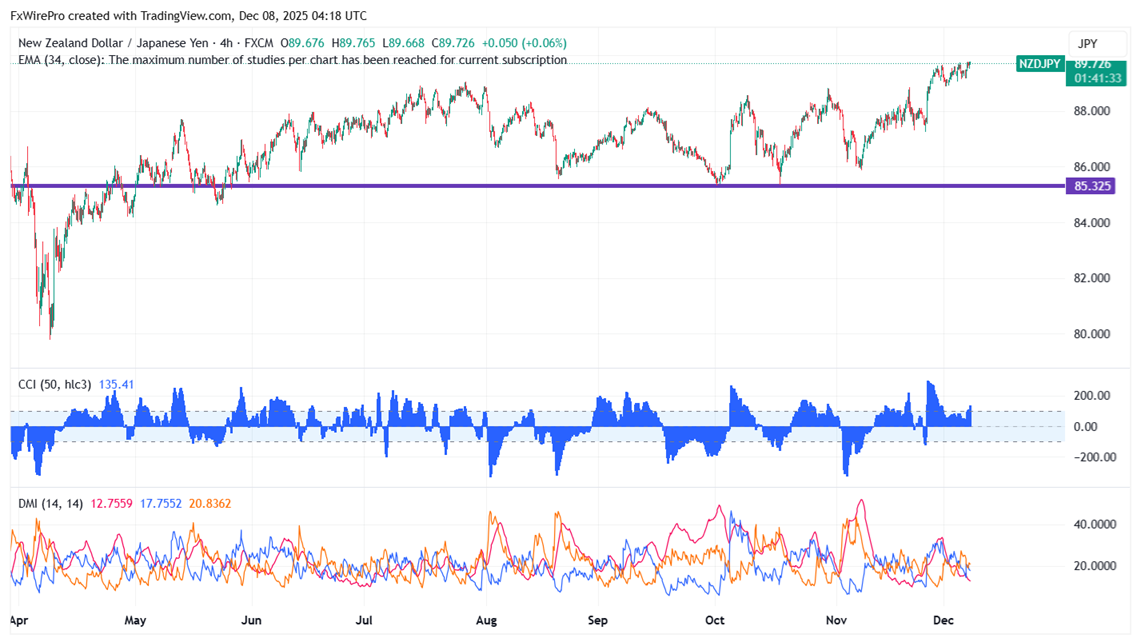
NZDJPY traded in a narrow range between 89.78 and 88.87 for the past one week. As long as support at 88.70 persists, the intraday trend is bullish. The pair hit an intraday high of 89.76; it currently trades at about 89.76.
Oscillators and moving averages to forecast the trend of NZDJPY
CMP- 89.378
EMA (4-hour chart)
55-EMA- 89.11
200-EMA- 88.18
365-EMA- 87.79. The pair trades above the short (55 EMA) and long-term moving average(200 and 365).
Major support- 88.70. Any breach below will drag the pair down to 88.40/87.99/87.20/86.65/85.37/84.45/84. Immediate support at 89.18.
Major resistance - 89.80. Any break above 89.80 confirms minor bullishness, a jump to 90/90.65/92.
Indicator (4-hour chart)
CCI (50)- bullish
Average directional movement Index- Neutral. All indicators confirm a mixed trend.
It is good to buy on dips around 89 with SL around 88.70 for TP of 90/90.65.


