


 FxWirePro: GBP/NZD downtrend loses steam, remains on bearish path
  FxWirePro- Woodies pivot (Major)
  FxWirePro: GBP/USD hits one-month high, scope for further upside
  FxWirePro: AUD/USD edges lower, but bullish outlook persists
  FxWirePro:EUR/NZD stuck In narrow ranges, focus on near term support
  FxWirePro:EUR/NZD dips below lower range, bearish bias increases
  JPY Action Bias: Extremely Bullish Surge Ignites Across NZD, GBP & AUD
  FxWirePro- Major Crypto levels and bias summary
  FxWirePro: GBP/NZD gains some upside momentum but still bearish
  JPY Action Bias: CADJPY Turns Extremely Bullish While Other Pairs Hold Positive Ground
  AUDJPY Bullish Surge: Strong Australian Dollar Fuels Fresh Upside as Pair Holds Above 113.50 and All EMAs Align
  FxWirePro- Major Pair levels and bias summary
  GBPJPY Bullish Surge: Strong Pound Ignites Fresh Upside on Fed-BOE Policy Divergence as All EMAs Align
  FxWirePro: USD/CAD falls after BoC rate hold and weak U.S. producer inflation


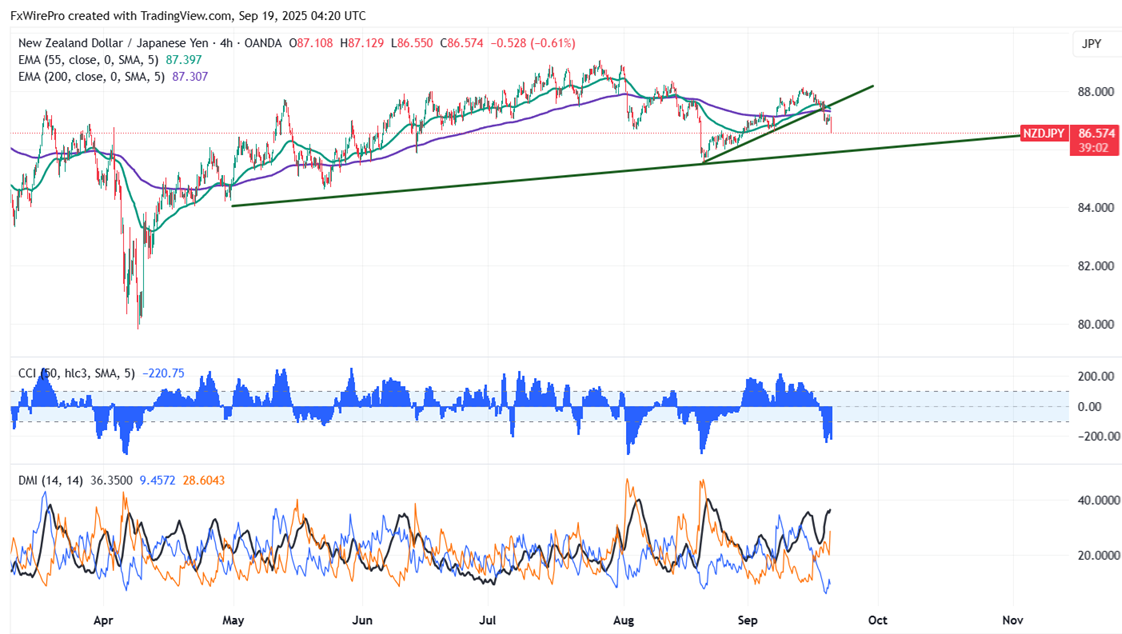
NZDJPY pared most of its gains after the BOJ's monetary policy. Intraday trend remains bearish as long as the resistance at 87.40 holds. Hitting an intraday low of 86.52, it presently trades at about 86.536. As long as the resistance at 89.20 remains intact, the general bearish trend is still valid.
With a deficit of NZD 1.185 billion, much beyond the market expectation of NZD, New Zealand's trade balance for August 2025 showed a major worsening. July's NZD 578 million and 746 million. Falling exports drove the decline; imports barely declined to NZD 7.12 billion from NZD 6.71 billion in July to NZD 5.94 billion. Although the monthly drop continued, the 12-month rolling deficit fell from NZD 3.94 billion to NZD 2.99 billion. Released by Statistics New Zealand on September 18, 2025, at 10:45 PM GMT, the data weighed on the New Zealand dollar and pushed NZD/USD under 0.5900 because of worries about poor export performance.
The Bank of Japan (BOJ) held its benchmark interest rate steady at 0.5% during its September 19, 2025, meeting, marking the fifth consecutive time rates have remained unchanged since the last hike in January 2025. The decision reflects caution amid political uncertainty following Prime Minister Shigeru Ishiba’s resignation and economic concerns over U.S. President Trump’s tariffs and weakening American data. Core consumer prices rose 2.7% year-on-year in August, remaining above the BOJ's 2% target despite three months of deceleration, with inflation forecasted to ease to 1.8% in FY2026 before returning to 2% in FY2027. Although the BOJ held rates steady, speculation continues about a possible hike as soon as October. Markets largely absorbed the decision, highlighting the stark contrast between Japan’s stable policy stance and the U.S. Federal Reserve’s recent rate cut. At 0.5%, Japan's policy rate remains its highest since the global financial crisis.
Technicals-
The pair is trading below 55 EMA, 200-EMA, and 365 EMA in the 4-hour chart.
The near-term resistance is around 87.20, breach above targets 87.40/89.20/90. The immediate support is at 86.50 any violation below will drag the pair to 86/85.50/85.10/84.06.
Indicator (4-hour chart)
CCI (50)- Bearish
Average directional movement Index-
Bearish. All indicators confirm a bearish trend.
It is good to sell on rallies around 87 with SL around 87.40 for TP of 85.


